List of United States congressional districts
Change in apportionment of congressional districts , starting in 2023, as a result of the 2020 United States census Change within apportionment of congressional districts , starting in 2013, as a result of the 2010 United States census Change within apportionment of congressional districts , starting in 2003, as a result of the 2000 United States census Change in apportionment of congressional districts , starting in 1993, as a result of the 1990 United States census Congressional districts in the United States are electoral divisions for the purpose of electing members of the United States House of Representatives . The number of voting seats within the House of Representatives is currently set at 435, with each one representing an average of 761,169 people following the 2020 United States census .[ 1] Alaska and Hawaii . The total number of state members is capped by the Reapportionment Act of 1929 .[ 2] U.S. territories and the federal district of Washington, D. C. , sends a non-voting delegate to the House of Representatives.
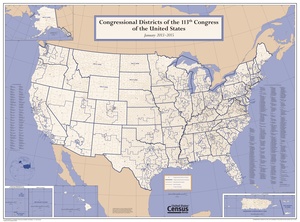
The Bureau of the Census conducts a constitutionally mandated decennial census whose figures are used to determine the number of congressional districts to which each state is entitled, in a process called "apportionment ". The 2022 elections were the first to be based on the congressional districts which were defined based on the 2020 United States census .[ 3]
Each state is responsible for the redistricting of districts within their state, while several states have one "at-large" division. Redistricting must take place if the number of members changes following a re-apportionment, or may take place at any other time if demographics represented in a district have changed substantially. Setting the boundaries of states' congressional districts is the responsibility of state governments, who often gerrymander districts for various reasons. Districts may sometimes retain the same boundaries, while changing their district numbers.
The following is a complete list of the 435 current congressional districts for the House of Representatives, and over 200 obsolete districts, and the six current and one obsolete non-voting delegations.
Extremes
Population
Average population: 761,169 people based on 2020 U.S. census.[ 1]
State with the most people in the average district: Delaware (989,948).[ 1]
State with the fewest people in the average district: Montana (542,113).[ 1] Rhode Island : 527,624.
District with the most people: Delaware at-large [ 1] Montana at-large
District with the fewest people: Rhode Island's 1st [ 4] Rhode Island's 1st
Area
Oldest district
American Human Development Index
Cook Partisan Voting Index
Alabama
Alabama's congressional districts since 2023
Territory At-large 1st district 2nd district 3rd district 4th district 5th district 6th district 7th district 8th district 1970 census )9th district 1960 census )10th district 1930 census )
Alaska
Alaska's at-large district since 1959
American Samoa
See Non-voting delegations , below.
Arizona
Arizona's congressional districts since 2023
Arkansas
Arkansas's congressional districts since 2023
California
California's congressional districts since 2023
Colorado
Colorado's congressional districts since 2023
Connecticut
Connecticut's congressional districts since 2023
Delaware
Delaware's at-large district since 1789 The oldest district in the country, it has never changed its shape or size. From 1813 to 1823, Delaware had two representatives — both chosen at-large on a general ticket from the same statewide district.
District of Columbia
See Non-voting delegations , below.
Florida
Florida's congressional districts since 2023
Georgia
Georgia's congressional districts since 2023 At-large 1st district 2nd district 3rd district 4th district 5th district 6th district 7th district 8th district 9th district 10th district 11th district 12th district 13th district 14th district
Guam
See Non-voting delegations , below.
Hawaii
Hawaii's congressional districts since 2023
Idaho
Map of Idaho's congressional districts since 2023
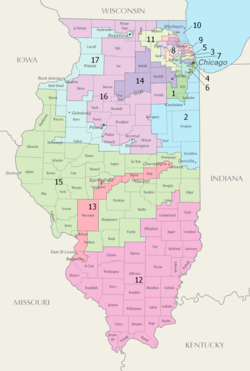
Illinois
Illinois's congressional districts since 2023
Indiana
Indiana's congressional districts since 2023
Iowa
Iowa's congressional districts since 2023
Kansas
Kansas's congressional districts since 2023
Kentucky
Kentucky's congressional districts since 2023 At-large 1st district 2nd district 3rd district 4th district 5th district 6th district 7th district 1990 census )8th district 1960 census )9th district 1950 census )10th district 1930 census )11th district 1930 census )12th district 1840 census )13th district 1840 census )
Louisiana
Louisiana's congressional districts since 2023
Maine
Maine's congressional districts since 2023 Until 1820, Maine was part of Massachusetts. After the 1810 census , Massachusetts was allocated 20 districts. Seven Massachusetts districts (then numbered 14 20 District of Maine .
Maryland
Maryland's congressional districts since 2023
Massachusetts
Massachusetts's congressional districts since 2023 At-large 1st district 2nd district 3rd district 4th district 5th district 6th district 7th district 8th district 9th district 10th district 2010 census )11th district 1990 census )12th district 1980 census )13th district 1960 census )14th district 1960 census )15th district 1940 census )16th district 1930 census )17th district [ notes 1] 18th district [ notes 1] 19th district [ notes 1] 20th district [ notes 1]
Michigan
Michigan's congressional districts since 2023
Minnesota
Minnesota's congressional districts since 2023 Territory At-large 1st district 2nd district 3rd district 4th district 5th district 6th district 7th district 8th district 9th district 1960 census )10th district 1930 census )
Mississippi
Mississippi's congressional districts since 2023
Missouri
Missouri's congressional districts from 2023
Territory At-large 1st district 2nd district 3rd district 4th district 5th district 6th district 7th district 8th district 9th district 2010 census )10th district 1980 census )11th district 1960 census )12th district 1950 census )13th district 1950 census )14th district 1930 census )15th district 1930 census )16th district 1930 census )
Montana
Montana's congressional districts since 2023
Nebraska
Nebraska's congressional districts since 2023
Nevada
Nevada's congressional districts since 2023
New Hampshire
New Hampshire's congressional districts since 2023
New Jersey
New Jersey's congressional districts since 2023 At-large 1st district 2nd district 3rd district 4th district 5th district 6th district 7th district 8th district 9th district 10th district 11th district 12th district 13th district 2010 census )14th district 1990 census )15th district 1980 census )
New Mexico
New Mexico's congressional districts since 2023
New York
New York's congressional districts since 2023
North Carolina
North Carolina's congressional districts since 2023
North Dakota
North Dakota's at-large district since 1973
Northern Mariana Islands
See Non-voting delegations , below.
Ohio
Ohio's congressional districts since 2023
Oklahoma
Oklahoma's congressional districts since 2023
Oregon
Oregon's congressional districts since 2023
Pennsylvania
Pennsylvania's congressional districts since 2023 At-large 1st district 2nd district 3rd district 4th district 5th district 6th district 7th district 8th district 9th district 10th district 11th district 12th district 13th district 14th district 15th district 16th district 17th district 18th district 2020 census )19th district 2010 census )20th district 2000 census )21st district 2000 census )22nd district 1990 census )23rd district 1990 census )24th district 1980 census )25th district 1980 census )26th district 1970 census )27th district 1970 census )28th district 1960 census )29th district 1960 census )30th district 1960 census )31st district 1950 census )32nd district 1950 census )33rd district 1950 census )34th district 1940 census )35th district 1930 census )36th district 1930 census )
Philippines
See Non-voting delegations , below.
Puerto Rico
See Non-voting delegations , below.
Rhode Island
Rhode Island's congressional districts since 2013
South Carolina
South Carolina's congressional districts since 2023
South Dakota
South Dakota's at-large district since 1983
Tennessee
Tennessee's congressional districts since 2023
Texas
Texas's congressional districts since 2023
U.S. Virgin Islands
See Non-voting delegations , below.
Utah
Utah's congressional districts since 2023
Vermont
Vermont's at-large district since 1933 At-large 1st district 1930 census )2nd district 1930 census )3rd district 1880 census )4th district 1850 census )5th district 1840 census )6th district 1820 census )
Virginia
Virginia's congressional districts since 2023 At-large 1st district 2nd district 3rd district 4th district 5th district 6th district 7th district 8th district 9th district 10th district 11th district 12th district West Virginia )13th district West Virginia )14th district 1850 census )15th district 1850 census )16th district 1840 census )17th district 1840 census )18th district 1840 census )19th district 1840 census )20th district 1840 census )21st district 1840 census )22nd district 1830 census )23rd district 1820 census )
Washington
Washington's congressional districts since 2023
West Virginia
West Virginia's congressional districts since 2023
Wisconsin
Wyoming
Wyoming's at-large district since 1869
Non-voting delegations
2013 U.S. congressional districts with territories
List of districts by area
The list includes the 435 voting districts of the 119th United States Congress , effective from 2025 to 2027.[ 6]
Rank
District
Land area2 )
Land area2 )
1
Alaska at-large
571,241.61
1,479,508.97
2
Montana 2
105,382.55
272,939.56
3
Wyoming at-large
97,088.55
251,458.19
4
South Dakota at-large
75,807.94
196,341.67
5
Oregon 2
72,158.83
186,890.52
6
Nebraska 3
69,613.74
180,298.76
7
North Dakota at-large
68,994.26
178,694.32
8
Nevada 2
65,065.49
168,518.85
9
Texas 23
58,788.47
152,261.44
10
Arizona 2
58,353.74
151,135.50
11
New Mexico 3
52,316.48
135,499.06
12
New Mexico 2
51,426.16
133,193.13
13
Colorado 3
49,950.41
129,370.97
14
Kansas 1
49,634.61
128,553.04
15
Idaho 2
43,245.56
112,005.50
16
Nevada 4
41,790.41
108,236.67
17
Montana 1
40,167.69
104,033.84
18
Idaho 1
39,399.80
102,045.01
19
Utah 2
39,218.27
101,574.85
20
Texas 13
35,104.57
90,920.42
21
Oklahoma 3
32,613.10
84,467.53
22
Colorado 4
32,138.01
83,237.06
23
Minnesota 8
31,239.65
80,910.32
24
Minnesota 7
31,039.41
80,391.69
25
Texas 19
30,169.59
78,138.89
26
Utah 3
28,715.22
74,372.07
27
Maine 2
27,548.04
71,349.09
28
Michigan 1
26,920.07
69,722.66
29
California 1
26,393.41
68,358.62
30
Arizona 9
23,229.33
60,163.69
31
Wisconsin 7
23,110.54
59,856.02
32
Arkansas 4
22,676.60
58,732.14
33
California 3
21,666.74
56,116.60
34
Oklahoma 2
21,630.58
56,022.95
35
Iowa 4
21,433.05
55,511.35
36
Missouri 6
20,254.59
52,459.15
37
Arkansas 1
19,849.09
51,408.90
38
Texas 11
19,205.73
49,742.61
39
Washington 5
18,711.90
48,463.59
40
Missouri 8
18,315.28
47,436.36
41
Mississippi 2
17,996.03
46,609.52
42
California 23
17,966.66
46,533.43
43
Washington 4
17,885.49
46,323.19
44
New Mexico 1
17,570.09
45,506.33
45
Illinois 15
16,752.80
43,389.55
46
New York 21
16,288.85
42,187.94
47
Arizona 7
15,417.65
39,931.54
48
Kansas 2
15,298.46
39,622.83
49
Louisiana 4
14,603.32
37,822.42
50
Kansas 4
14,563.96
37,720.49
51
Missouri 4
14,355.14
37,179.63
52
West Virginia 1
14,340.14
37,140.79
53
Illinois 12
14,015.96
36,301.17
54
Arizona 6
13,691.88
35,461.79
55
California 2
13,038.54
33,769.65
56
Pennsylvania 15
12,982.18
33,623.68
57
Iowa 2
12,902.70
33,417.83
58
Minnesota 1
12,238.15
31,696.67
59
California 25
11,955.87
30,965.57
60
Kentucky 5
11,748.97
30,429.69
61
Mississippi 3
11,722.42
30,360.94
62
Oregon 4
11,613.07
30,077.72
63
Kentucky 1
11,499.40
29,783.31
64
Colorado 2
11,445.07
29,642.60
65
Texas 28
11,357.29
29,415.25
66
Wisconsin 3
11,227.74
29,079.72
67
Georgia 8
10,928.22
28,303.96
68
Iowa 1
10,844.57
28,087.31
69
Iowa 3
10,673.35
27,643.86
70
Louisiana 5
10,456.54
27,082.31
71
Texas 17
10,437.15
27,032.09
72
Texas 27
10,428.06
27,008.56
73
Alabama 7
10,274.64
26,611.19
74
Utah 1
10,271.32
26,602.61
75
Virginia 9
10,070.55
26,082.60
76
Georgia 2
9,953.18
25,778.63
77
Mississippi 1
9,942.04
25,749.77
78
Florida 2
9,853.83
25,521.31
79
Washington 8
9,827.75
25,453.76
80
California 5
9,807.72
25,401.89
81
Oklahoma 4
9,733.71
25,210.18
82
Michigan 2
9,704.77
25,135.24
83
West Virginia 2
9,701.10
25,125.73
84
California 20
9,672.81
25,052.46
85
Georgia 12
9,632.95
24,949.22
86
Alabama 2
9,465.03
24,514.32
87
Texas 1
9,464.63
24,513.29
88
Virginia 5
9,464.11
24,511.93
89
Tennessee 8
9,226.41
23,896.29
90
Vermont at-large
9,217.26
23,872.59
91
Texas 25
8,994.96
23,296.84
92
Illinois 16
8,914.43
23,088.27
93
Alabama 4
8,630.11
22,351.89
94
North Carolina 1
8,342.08
21,605.90
95
New York 19
8,225.38
21,303.64
96
Indiana 8
8,096.08
20,968.75
97
Texas 10
7,667.75
19,859.38
98
Louisiana 3
7,625.36
19,749.60
99
Missouri 3
7,584.79
19,644.52
100
Ohio 2
7,383.46
19,123.06
101
Georgia 1
7,360.10
19,062.57
102
Florida 3
7,321.91
18,963.66
103
Washington 3
7,309.49
18,931.50
104
Kentucky 2
7,291.99
18,886.16
105
Mississippi 4
7,264.08
18,813.89
106
Alabama 1
7,240.75
18,753.46
107
Colorado 7
7,161.21
18,547.45
108
New York 24
7,088.57
18,359.31
109
Washington 6
6,956.61
18,017.54
110
South Carolina 6
6,926.08
17,938.45
111
North Carolina 3
6,850.07
17,741.59
112
New Hampshire 2
6,810.15
17,638.22
113
Alabama 3
6,690.22
17,327.58
114
Wisconsin 8
6,680.87
17,303.37
115
Tennessee 4
6,473.25
16,765.63
116
New York 23
6,458.25
16,726.78
117
Florida 18
6,449.60
16,704.38
118
Pennsylvania 13
6,362.38
16,478.49
119
Texas 21
6,297.31
16,309.95
120
California 13
6,292.60
16,297.75
121
Virginia 6
6,264.60
16,225.23
122
North Carolina 11
6,242.65
16,168.40
123
Texas 15
6,230.46
16,136.81
124
Hawaii 2
6,219.49
16,108.40
125
Indiana 4
6,096.60
15,790.13
126
Pennsylvania 9
6,073.27
15,729.69
127
Indiana 9
6,037.01
15,635.78
128
Nebraska 1
5,982.30
15,494.09
129
Texas 36
5,944.78
15,396.91
130
Tennessee 6
5,919.07
15,330.32
131
Tennessee 7
5,891.32
15,258.45
132
Texas 6
5,858.52
15,173.49
133
Missouri 7
5,775.52
14,958.52
134
South Carolina 3
5,633.91
14,591.76
135
Texas 31
5,612.90
14,537.36
136
Oregon 5
5,591.62
14,482.23
137
Ohio 12
5,580.81
14,454.22
138
Ohio 5
5,528.22
14,318.02
139
South Carolina 7
5,407.67
14,005.81
140
Arkansas 2
5,301.54
13,730.93
141
Michigan 5
5,233.18
13,553.87
142
Georgia 10
5,204.81
13,480.39
143
Texas 4
5,201.82
13,472.66
144
South Carolina 5
5,160.49
13,365.62
145
Wisconsin 6
5,030.60
13,029.20
146
California 24
4,886.14
12,655.03
147
Ohio 4
4,879.90
12,638.89
148
Louisiana 6
4,869.79
12,612.70
149
Kentucky 4
4,844.51
12,547.21
150
North Carolina 7
4,841.79
12,540.17
151
Ohio 6
4,779.15
12,377.95
152
Pennsylvania 14
4,774.73
12,366.50
153
Michigan 9
4,638.21
12,012.91
154
California 18
4,572.91
11,843.79
155
Illinois 17
4,481.92
11,608.12
156
Alabama 6
4,448.50
11,521.57
157
Washington 2
4,404.09
11,406.54
158
Utah 4
4,390.89
11,372.35
159
Indiana 3
4,390.44
11,371.18
160
Tennessee 1
4,354.28
11,277.53
161
Indiana 2
4,349.54
11,265.25
162
California 22
4,313.07
11,170.80
163
Wisconsin 2
4,300.90
11,139.29
164
North Carolina 5
4,201.04
10,880.63
165
Georgia 3
4,166.22
10,790.46
166
Arkansas 3
4,164.71
10,786.55
167
Texas 34
4,121.86
10,675.56
168
Tennessee 3
3,956.32
10,246.81
169
Illinois 2
3,916.79
10,144.45
170
Alabama 5
3,901.77
10,105.55
171
Maryland 1
3,866.41
10,013.95
172
Pennsylvania 16
3,840.90
9,947.90
173
Kentucky 6
3,792.81
9,823.32
174
California 4
3,780.05
9,790.27
175
North Carolina 8
3,725.02
9,647.75
176
North Carolina 13
3,715.91
9,624.17
177
Louisiana 1
3,652.62
9,460.24
178
California 48
3,614.69
9,362.01
179
Texas 5
3,597.13
9,316.51
180
Oklahoma 5
3,540.68
9,170.31
181
Virginia 4
3,427.39
8,876.91
182
Florida 6
3,410.11
8,832.15
183
Georgia 9
3,405.52
8,820.25
184
Oregon 1
3,351.98
8,681.58
185
Maine 1
3,297.05
8,539.31
186
Indiana 6
3,282.32
8,501.18
187
North Carolina 9
3,254.05
8,427.95
188
Florida 1
3,197.64
8,281.85
189
Texas 22
3,156.50
8,175.31
190
South Carolina 2
3,113.05
8,062.76
191
Virginia 1
3,039.12
7,871.28
192
Georgia 14
2,942.34
7,620.62
193
Texas 8
2,848.23
7,376.88
194
California 19
2,816.56
7,294.86
195
Pennsylvania 8
2,769.36
7,172.61
196
Michigan 7
2,766.00
7,163.91
197
Virginia 7
2,723.77
7,054.54
198
South Carolina 1
2,589.15
6,705.86
199
Ohio 9
2,588.55
6,704.30
200
Tennessee 2
2,576.12
6,672.13
201
Minnesota 6
2,484.44
6,434.68
202
Texas 14
2,450.81
6,347.56
203
Ohio 14
2,432.65
6,300.55
204
New York 22
2,421.90
6,272.69
205
Maryland 6
2,395.10
6,203.29
206
Michigan 4
2,386.19
6,180.21
207
Florida 26
2,300.65
5,958.66
208
Illinois 13
2,264.31
5,864.53
209
Kansas 3
2,261.58
5,857.46
210
Massachusetts 1
2,233.36
5,784.38
211
Michigan 8
2,230.81
5,777.78
212
Indiana 5
2,194.78
5,684.44
213
North Carolina 14
2,192.36
5,678.18
214
Florida 28
2,184.62
5,658.15
215
Florida 20
2,151.66
5,572.78
216
Virginia 2
2,150.83
5,570.62
217
New Hampshire 1
2,143.64
5,551.99
218
Wisconsin 5
2,143.50
5,551.64
219
Tennessee 5
2,059.04
5,332.90
220
Connecticut 2
2,021.15
5,234.75
221
Louisiana 2
2,005.26
5,193.59
222
Nevada 3
2,004.83
5,192.50
223
New Jersey 2
1,994.30
5,165.22
224
Illinois 14
1,974.93
5,115.05
225
Texas 26
1,965.74
5,091.24
226
Delaware at-large
1,948.54
5,046.69
227
Ohio 15
1,925.67
4,987.47
228
Oregon 6
1,895.03
4,908.11
229
North Carolina 10
1,871.94
4,848.30
230
New York 18
1,862.87
4,824.80
231
Ohio 8
1,792.67
4,642.98
232
Missouri 2
1,790.83
4,638.24
233
Massachusetts 2
1,783.82
4,620.06
234
Florida 4
1,782.00
4,615.36
235
Minnesota 2
1,727.80
4,474.97
236
California 26
1,714.89
4,441.53
237
Virginia 10
1,690.49
4,378.36
238
North Carolina 6
1,652.02
4,278.70
239
Florida 12
1,650.67
4,275.21
240
Florida 9
1,650.42
4,274.56
241
Florida 8
1,640.02
4,247.63
242
Florida 11
1,600.09
4,144.21
243
Arizona 1
1,597.51
4,137.52
244
Wisconsin 1
1,533.90
3,972.78
245
Maryland 5
1,516.81
3,928.53
246
California 27
1,516.11
3,926.71
247
Florida 21
1,506.29
3,901.27
248
Pennsylvania 11
1,501.23
3,888.18
249
Georgia 11
1,475.93
3,822.63
250
Colorado 5
1,471.80
3,811.94
251
Florida 17
1,453.66
3,764.95
252
Texas 3
1,435.72
3,718.50
253
Oregon 3
1,386.21
3,590.26
254
New York 20
1,366.03
3,538.01
255
New Jersey 7
1,347.62
3,490.31
256
California 9
1,346.85
3,488.34
257
California 41
1,327.17
3,437.35
258
Ohio 7
1,320.78
3,420.81
259
Massachusetts 9
1,255.16
3,250.84
260
Pennsylvania 10
1,254.75
3,249.79
261
Connecticut 5
1,246.13
3,227.45
262
South Carolina 4
1,233.75
3,195.40
263
Nebraska 2
1,218.96
3,157.10
264
Pennsylvania 7
1,167.73
3,024.40
265
Florida 16
1,154.48
2,990.09
266
Indiana 1
1,102.37
2,855.12
267
Georgia 7
1,101.44
2,852.73
268
New Jersey 3
1,080.77
2,799.19
269
Oklahoma 1
1,078.63
2,793.65
270
North Carolina 4
1,052.90
2,726.99
271
Colorado 8
1,010.07
2,616.08
272
Nevada 1
999.63
2,589.03
273
Ohio 10
990.48
2,565.33
274
Michigan 6
978.11
2,533.30
275
Texas 12
964.72
2,498.62
276
Pennsylvania 6
925.01
2,395.76
277
Illinois 11
918.71
2,379.45
278
Pennsylvania 17
893.14
2,313.23
279
California 21
891.31
2,308.48
280
Florida 7
834.48
2,161.28
281
New York 17
824.68
2,135.92
282
Maryland 2
811.19
2,100.96
283
Michigan 3
804.84
2,084.53
284
California 28
787.85
2,040.52
285
Tennessee 9
768.53
1,990.48
286
Rhode Island 2
766.01
1,983.96
287
Massachusetts 3
750.36
1,943.43
288
Pennsylvania 4
725.88
1,880.03
289
Washington 10
707.98
1,833.65
290
New York 25
707.68
1,832.89
291
Pennsylvania 1
699.56
1,811.85
292
California 7
680.45
1,762.37
293
Florida 19
679.40
1,759.64
294
Massachusetts 4
672.20
1,740.99
295
New York 1
663.47
1,718.38
296
Connecticut 1
656.44
1,700.16
297
Florida 15
654.30
1,694.62
298
New Jersey 4
651.25
1,686.73
299
New Jersey 5
649.45
1,682.06
300
Texas 2
628.51
1,627.83
301
Ohio 13
621.80
1,610.47
302
Illinois 1
611.55
1,583.92
303
Ohio 1
601.39
1,557.59
304
Florida 5
592.02
1,533.33
305
California 14
580.46
1,503.39
306
Arizona 8
575.29
1,489.99
307
California 10
537.41
1,391.89
308
Georgia 13
534.20
1,383.58
309
Massachusetts 6
532.67
1,379.62
310
California 16
529.07
1,370.28
311
Texas 35
520.74
1,348.70
312
Georgia 6
517.34
1,339.90
313
Illinois 10
510.14
1,321.25
314
Maryland 3
500.61
1,296.56
315
California 49
495.94
1,284.48
316
California 8
481.18
1,246.25
317
Connecticut 3
473.93
1,227.48
318
Minnesota 3
468.11
1,212.39
319
Connecticut 4
444.85
1,152.16
320
New Jersey 12
438.34
1,135.30
321
Pennsylvania 12
425.68
1,102.51
322
Missouri 5
422.31
1,093.78
323
North Carolina 2
408.99
1,059.28
324
Arizona 5
405.28
1,049.67
325
New Jersey 11
394.49
1,021.72
326
California 40
391.18
1,013.15
327
New Jersey 1
368.05
953.23
328
Texas 30
355.20
919.97
329
Washington 1
332.09
860.12
330
Texas 16
315.48
817.10
331
Michigan 11
315.15
816.24
332
Kentucky 3
307.75
797.07
333
Texas 38
307.68
796.89
334
Colorado 6
306.67
794.28
335
Minnesota 4
303.19
785.26
336
California 32
296.24
767.25
337
Massachusetts 8
293.39
759.88
338
Illinois 8
285.45
739.32
339
California 39
284.12
735.86
340
Indiana 7
276.01
714.86
341
Maryland 8
273.44
708.20
342
North Carolina 12
273.35
707.96
343
Texas 24
270.75
701.24
344
Georgia 4
269.42
697.81
345
Florida 14
269.11
696.99
346
Rhode Island 1
267.88
693.81
347
New York 26
261.43
677.11
348
Florida 10
256.79
665.07
349
California 50
256.53
664.41
350
Virginia 3
252.37
653.64
351
California 6
251.52
651.43
352
Virginia 11
250.95
649.96
353
Florida 22
250.75
649.43
354
Missouri 1
247.95
642.19
355
New York 2
238.59
617.94
356
Texas 18
230.76
597.66
357
Pennsylvania 5
229.20
593.63
358
Florida 13
227.70
589.75
359
Michigan 10
227.27
588.62
360
Illinois 6
225.22
583.31
361
Georgia 5
225.10
583.01
362
Texas 37
223.50
578.85
363
Massachusetts 5
219.31
568.01
364
Texas 33
218.79
566.66
365
Ohio 3
217.80
564.10
366
Texas 9
217.55
563.45
367
Maryland 4
217.17
562.46
368
Ohio 11
215.59
558.38
369
Michigan 13
215.30
557.63
370
California 42
212.29
549.84
371
California 31
207.67
537.87
372
Arizona 3
205.87
533.20
373
Texas 29
205.63
532.58
374
Hawaii 1
203.10
526.03
375
Florida 25
198.76
514.78
376
New York 3
192.83
499.44
377
New Jersey 6
191.78
496.70
378
Michigan 12
191.05
494.82
379
California 51
189.93
491.91
380
California 33
189.19
490.00
381
Washington 9
182.64
473.03
382
Texas 20
179.50
464.90
383
California 17
179.32
464.45
384
California 30
179.30
464.38
385
Arizona 4
178.85
463.21
386
California 35
177.22
459.01
387
California 47
173.09
448.29
388
Illinois 9
167.73
434.43
389
Florida 23
165.04
427.46
390
Illinois 5
155.10
401.72
391
Colorado 1
153.90
398.60
392
Illinois 3
153.85
398.46
393
California 38
149.33
386.77
394
Texas 32
149.12
386.22
395
Virginia 8
147.21
381.28
396
Wisconsin 4
139.97
362.53
397
Washington 7
137.41
355.88
398
California 52
135.29
350.39
399
Minnesota 5
130.81
338.81
400
Texas 7
130.71
338.55
401
Maryland 7
130.22
337.28
402
California 29
128.97
334.03
403
New York 16
124.04
321.27
404
Florida 27
119.23
308.81
405
California 15
116.24
301.07
406
New York 4
114.05
295.40
407
New Jersey 9
110.74
286.82
408
California 45
103.62
268.38
409
Florida 24
99.61
257.98
410
California 36
97.11
251.52
411
Illinois 4
95.76
248.01
412
California 12
92.66
239.98
413
California 44
91.14
236.04
414
New Jersey 10
77.54
200.83
415
California 46
74.78
193.68
416
California 43
72.18
186.94
417
Illinois 7
68.43
177.22
418
New York 11
64.23
166.35
419
Pennsylvania 2
64.02
165.81
420
Massachusetts 7
60.69
157.19
421
Pennsylvania 3
53.06
137.44
422
California 37
52.77
136.66
423
New Jersey 8
50.63
131.12
424
California 34
49.68
128.66
425
New York 5
47.10
121.99
426
California 11
41.37
107.15
427
New York 14
29.33
75.97
428
New York 8
26.68
69.10
429
New York 6
25.80
66.83
430
New York 7
21.95
56.84
431
New York 15
18.60
48.17
432
New York 10
15.33
39.71
433
New York 9
15.21
39.38
434
New York 13
11.01
28.51
435
New York 12
9.57
24.78
See also
Comparisons
Notes
^ a b c d Maine used to be part of Massachusetts. After the 1810 census , Massachusetts was allocated 20 districts. Seven districts (numbers 14 through 20) were credited to Maine soon after it became a state in 1820.
References
Sources
External links
Membership
Members Senate House New members
Leaders
Districts Groups
Related
Powers, privileges, procedure, committees, history, media
Regions Native areas Metropolitan State-level County-level Local


.png)


.png)


.svg)


.png)


.png)