1912 United States presidential election in Maryland
1912 United States presidential election in Maryland
County Results
Wilson
30-40%
40-50%
50-60%
Roosevelt
30-40%
Taft
50-60%
The 1912 United States presidential election in Maryland took place on November 5 , 1912 , as part of the 1912 United States presidential election . State voters chose eight representatives, or electors, to the Electoral College , who voted for president and vice president .
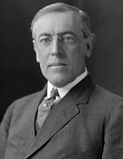
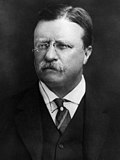
Maryland was won by Princeton University President Woodrow Wilson (D –New Jersey ), running with governor of Indiana Thomas R. Marshall , with 48.57% of the popular vote, against the 26th president of the United States Theodore Roosevelt (P –New York ), running with governor of California Hiram Johnson , with 24.91% of the popular vote and the 27th president of the United States William Howard Taft (R –Ohio ), running with Columbia University President Nicholas Murray Butler , with 23.69% of the popular vote.[ 1] 2020 presidential election [update] Garrett County did not support the Republican candidate.[ 2] Carroll County by more than 10%.[ 3]
This was the first time since 1892 that a Democrat won the popular vote in Maryland.
Results
Results by county
County
Thomas Woodrow Wilson
William Howard Taft
Theodore Roosevelt
Various candidates
Margin[ a]
Total votes cast[ 4]
#
%
#
%
#
%
#
%
#
%
Allegany
3,382
39.36%
1,396
16.25%
2,631
30.62%
1,184
13.78%
751
8.74%
8,593
Anne Arundel
3,049
46.10%
2,222
33.60%
794
12.00%
549
8.30%
827[ b]
12.50%
6,614
Baltimore
11,524
51.65%
4,247
19.03%
6,211
27.84%
330
1.48%
5,313
23.81%
22,312
Baltimore City
48,030
48.36%
15,597
15.70%
33,679
33.91%
2,016
2.03%
14,351
14.45%
99,322
Calvert
616
34.74%
1,035
58.38%
83
4.68%
39
2.20%
-419[ b]
-23.63%
1,773
Caroline
1,882
51.63%
1,445
39.64%
196
5.38%
122
3.35%
437[ b]
11.99%
3,645
Carroll
3,616
50.11%
2,546
35.28%
923
12.79%
131
1.82%
1,070[ b]
14.83%
7,216
Cecil
2,491
52.60%
1,509
31.86%
646
13.64%
90
1.90%
982[ b]
20.73%
4,736
Charles
918
34.69%
1,573
59.45%
113
4.27%
42
1.59%
-655[ b]
-24.75%
2,646
Dorchester
2,509
47.08%
2,387
44.79%
313
5.87%
120
2.25%
122[ b]
2.29%
5,329
Frederick
5,545
48.81%
2,813
24.76%
2,776
24.44%
226
1.99%
2,732[ b]
24.05%
11,360
Garrett
1,005
34.42%
655
22.43%
1,069
36.61%
191
6.54%
-64
-2.19%
2,920
Harford
3,064
53.63%
1,737
30.40%
802
14.04%
110
1.93%
1,327[ b]
23.23%
5,713
Howard
1,523
51.45%
1,004
33.92%
364
12.30%
69
2.33%
519[ b]
17.53%
2,960
Kent
1,816
53.73%
1,021
30.21%
463
13.70%
80
2.37%
795[ b]
23.52%
3,380
Montgomery
3,501
56.10%
1,675
26.84%
884
14.16%
181
2.90%
1,826[ b]
29.26%
6,241
Prince George's
2,424
45.38%
1,456
27.26%
1,308
24.49%
153
2.86%
968[ b]
18.12%
5,341
Queen Anne's
1,902
55.52%
1,311
38.27%
119
3.47%
94
2.74%
591[ b]
17.25%
3,426
Somerset [ c] 843
36.09%
1,262
54.02%
144
6.16%
87
3.72%
-419[ b]
-17.94%
2,336
St. Mary's [ c] 1,617
45.51%
1,528
43.01%
370
10.41%
38
1.07%
89[ b]
2.50%
3,553
Talbot
1,888
47.13%
1,835
45.81%
190
4.74%
93
2.32%
53[ b]
1.32%
4,006
Washington
4,589
48.10%
1,907
19.99%
2,606
27.32%
438
4.59%
1,983
20.79%
9,540
Wicomico
3,176
55.02%
2,038
35.31%
442
7.66%
116
2.01%
1,138[ b]
19.72%
5,772
Worcester
1,764
54.33%
757
23.31%
663
20.42%
63
1.94%
1,007[ b]
31.01%
3,247
Totals
112,674
48.57%
54,956
23.69%
57,789
24.91%
6,562
2.83%
54,885
23.66%
231,981
Counties that flipped from Republican to Democratic
Counties that flipped from Republican to Progressive
See also
Notes
^ Because Roosevelt finished ahead of Taft in Maryland as a whole, all margins give are Wilson minus Roosevelt unless stated in the total for the county in question.
^ a b c d e f g h i j k l m n o p q r s In this county where Taft did run second ahead of Roosevelt, the margin given is that between Wilson and Taft.
^ a b Figures for Somerset and St. Mary’s Counties given both in Géoelections and in David Leip’s presidential election data have the counties reversed vis-à-vis the accompanying maps. The figures given here are based on the accompanying maps as these appear most likely given the results for these counties in adjacent “System of 1896 ” elections
References


