1860 United States presidential election in Maryland
1860 United States presidential election in Maryland
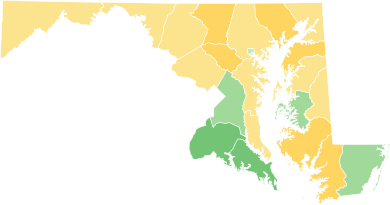
County Results
Breckenridge
40-50%
50-60%
60-70%
Bell
40-50%
50-60%
The 1860 United States presidential election in Maryland took place on November 6, 1860, as part of the 1860 United States presidential election . Maryland voters chose eight representatives, or electors, to the Electoral College , who voted for president and vice president .
Maryland was won by the Southern Democratic candidate 14th Vice President of the United States John C. Breckinridge of Kentucky and his running mate Senator Joseph Lane of Oregon . They defeated the Constitutional Union candidate Senator John Bell of Tennessee and his running mate the 15th Governor of Massachusetts Edward Everett as well as Democratic candidate Senator Stephen A. Douglas of Illinois and his running mate 41st Governor of Georgia Herschel V. Johnson . Breckinridge won the state by a narrow margin of 0.79%.
Despite coming in a distant fourth place with 2,294 votes Abraham Lincoln did receive over 2,000 more votes than John C. Frémont received in 1856 and would later win the state in 1864 with 55% of the vote.
Results
Results by county
County
John C. Breckinridge
Southern Democratic
John Bell
Constitutional Union
Stephen A. Douglas
Democratic
Abraham Lincoln
Republican
Margin
Total
Votes
Cast [ 2]
#
%
#
%
#
%
#
%
#
%
Allegany
979
23.17%
1,521
36.00%
1,203
28.47%
522
12.36%
-318
-7.53%
4,225
Anne Arundel
1,017
47.11%
1,041
48.22%
98
4.54%
3
0.14%
-24
-1.11%
2,159
Baltimore (City)
14,956
49.61%
12,604
41.81%
1,503
4.99%
1,083
3.59%
2,352
7.80%
30,146
Baltimore (County)
3,305
46.04%
3,388
47.19%
449
6.25%
37
0.52%
-83
-1.15%
7,179
Calvert
386
46.56%
399
48.13%
43
5.19%
1
0.12%
-13
-1.57%
829
Caroline
616
42.75%
712
49.44%
100
6.94%
12
0.83%
-96
-6.69%
1,440
Carroll
1,791
39.94%
2,295
51.18%
339
7.56%
59
1.32%
-504
-11.24%
4,484
Cecil
1,506
39.13%
1,792
46.56%
393
10.21%
158
4.10%
-286
-7.43%
3,849
Charles
723
60.40%
430
35.92%
38
3.17%
6
0.50%
293
24.48%
1,197
Dorchester
1,176
46.91%
1,265
50.46%
31
1.24%
35
1.40%
-89
-3.55%
2,507
Frederick
3,167
43.20%
3,616
49.32%
445
6.07%
103
1.40%
-449
-6.12%
7,331
Harford
1,527
42.99%
1,862
52.42%
82
2.31%
81
2.28%
-335
-9.43%
3,552
Howard
530
34.19%
830
53.55%
189
12.19%
1
0.06%
-300
-19.36%
1,550
Kent
694
41.76%
852
51.26%
74
4.45%
42
2.53%
-158
-9.50%
1,662
Montgomery
1,125
46.32%
1,155
47.55%
99
4.08%
50
2.06%
-30
-1.23%
2,429
Prince George's
1,048
53.01%
885
44.76%
43
2.18%
1
0.05%
163
8.25%
1,977
Queen Anne's
879
46.91%
908
48.45%
87
4.64%
0
0.00%
-29
-1.54%
1,874
St. Mary's
920
67.06%
261
19.02%
190
13.85%
1
0.07%
659
48.04%
1,372
Somerset
1,339
45.14%
1,536
51.79%
89
3.00%
2
0.07%
-197
-6.65%
2,966
Talbot
898
50.14%
793
44.28%
98
5.47%
2
0.11%
105
5.86%
1,791
Washington
2,475
45.66%
2,567
47.36%
283
5.22%
95
1.75%
-92
-1.70%
5,420
Worcester
1,425
55.60%
1,048
40.89%
90
3.51%
0
0.00%
377
14.71%
2,563
Totals:
42,482
45.93%
41,760
45.14%
5,966
6.45%
2,294
2.40%
722
0.79%
92,502
Counties that flipped from Democratic to Constitutional Union
Counties that flipped from Know Nothing to Constitutional Union
Counties that flipped from Know Nothing to Southern Democratic
See also
References


