1912 United States presidential election in Missouri
1912 United States presidential election in Missouri
County Results
Wilson
30-40%
40-50%
50-60%
60-70%
70-80%
80-90%
Taft
30-40%
40-50%
50-60%
Roosevelt
30-40%
The 1912 United States presidential election in Missouri took place on November 5 , 1912 , as part of the 1912 United States presidential election . Voters chose 18 representatives, or electors, to the Electoral College , who voted for president and vice president .
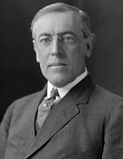
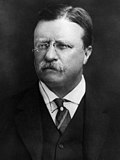
Missouri was won by governor of New Jersey Woodrow Wilson (D ), running with governor of Indiana Thomas R. Marshall , with 47.35% of the popular vote, against the 27th president of the United States William Howard Taft (R –Ohio ), running with Columbia University President Nicholas Murray Butler , with 29.75% of the popular vote and the 26th president of the United States Theodore Roosevelt (P –New York ), running with governor of California Hiram Johnson , with 17.80% of the popular vote.[ 1] 2020 presidential election [update] Douglas County and Ozark County did not vote for the Republican presidential candidate.[ 2] [ 3]
Results
Results by county
1912 United States presidential election in Missouri by county[ 4]
County
Woodrow Wilson William Howard Taft Theodore Roosevelt Eugene V. Debs Various candidates Other parties
Margin
Total votes cast
#
%
#
%
#
%
#
%
#
%
#
%
Adair
1,784
36.46%
1,427
29.16%
1,200
24.52%
398
8.13%
84
1.72%
357
7.30%
4,893
Andrew
1,750
45.00%
1,634
42.02%
432
11.11%
31
0.80%
42
1.08%
116
2.98%
3,889
Atchison
1,534
46.53%
1,138
34.52%
529
16.04%
37
1.12%
59
1.79%
396
12.01%
3,297
Audrain
3,332
64.79%
1,360
26.44%
377
7.33%
31
0.60%
43
0.84%
1,972
38.34%
5,143
Barry
2,300
45.65%
1,396
27.71%
1,053
20.90%
227
4.51%
62
1.23%
904
17.94%
5,038
Barton
1,791
47.12%
1,010
26.57%
639
16.81%
280
7.37%
81
2.13%
781
20.55%
3,801
Bates
3,057
50.72%
1,383
22.95%
1,301
21.59%
151
2.51%
135
2.24%
1,674
27.78%
6,027
Benton
1,209
39.57%
1,142
37.38%
618
20.23%
54
1.77%
32
1.05%
67
2.19%
3,055
Bollinger
1,512
48.93%
1,100
35.60%
348
11.26%
102
3.30%
28
0.91%
412
13.33%
3,090
Boone
5,027
70.23%
1,350
18.86%
695
9.71%
54
0.75%
32
0.45%
3,677
51.37%
7,158
Buchanan
8,869
53.18%
4,412
26.46%
2,639
15.83%
623
3.74%
133
0.80%
4,457
26.73%
16,676
Butler
1,946
41.71%
1,851
39.68%
408
8.75%
407
8.72%
53
1.14%
95
2.04%
4,665
Caldwell
1,483
40.36%
1,187
32.31%
965
26.27%
6
0.16%
33
0.90%
296
8.06%
3,674
Callaway
3,544
65.61%
1,525
28.23%
284
5.26%
13
0.24%
36
0.67%
2,019
37.38%
5,402
Camden
667
35.69%
918
49.12%
246
13.16%
30
1.61%
8
0.43%
-251
-13.43%
1,869
Cape Girardeau 2,587
44.19%
2,203
37.63%
899
15.36%
110
1.88%
55
0.94%
384
6.56%
5,854
Carroll
2,648
46.80%
1,519
26.85%
1,361
24.05%
73
1.29%
57
1.01%
1,129
19.95%
5,658
Carter
458
49.46%
256
27.65%
116
12.53%
78
8.42%
18
1.94%
202
21.81%
926
Cass
3,247
57.70%
1,034
18.38%
1,178
20.93%
103
1.83%
65
1.16%
2,069[ a]
36.77%
5,627
Cedar
1,392
40.42%
1,242
36.06%
623
18.09%
134
3.89%
53
1.54%
150
4.36%
3,444
Chariton
3,112
56.90%
1,528
27.94%
745
13.62%
37
0.68%
47
0.86%
1,584
28.96%
5,469
Christian
793
26.07%
1,203
39.55%
832
27.35%
176
5.79%
38
1.25%
371[ b]
12.20%
3,042
Clark
1,586
47.73%
1,214
36.53%
484
14.57%
12
0.36%
27
0.81%
372
11.19%
3,323
Clay
3,417
72.00%
592
12.47%
679
14.31%
41
0.86%
17
0.36%
2,738[ a]
57.69%
4,746
Clinton
1,968
56.42%
777
22.28%
679
19.47%
10
0.29%
54
1.55%
1,191
34.15%
3,488
Cole
2,447
50.29%
2,103
43.22%
252
5.18%
45
0.92%
19
0.39%
344
7.07%
4,866
Cooper
2,444
48.28%
2,270
44.84%
299
5.91%
26
0.51%
23
0.45%
174
3.44%
5,062
Crawford
1,037
41.71%
1,045
42.04%
327
13.15%
54
2.17%
23
0.93%
-8
-0.32%
2,486
Dade
1,313
38.81%
1,196
35.35%
776
22.94%
59
1.74%
39
1.15%
117
3.46%
3,383
Dallas
870
35.61%
1,051
43.02%
480
19.65%
24
0.98%
18
0.74%
-181
-7.41%
2,443
Daviess
2,284
49.29%
1,099
23.72%
1,170
25.25%
12
0.26%
69
1.49%
1,114[ a]
24.04%
4,634
DeKalb
1,652
50.18%
1,090
33.11%
499
15.16%
16
0.49%
35
1.06%
562
17.07%
3,292
Dent
1,280
51.38%
959
38.50%
153
6.14%
79
3.17%
20
0.80%
321
12.89%
2,491
Douglas
566
20.23%
855
30.56%
1,092
39.03%
255
9.11%
30
1.07%
-237[ b]
-8.47%
2,798
Dunklin
2,723
51.89%
987
18.81%
494
9.41%
1,001
19.07%
43
0.82%
1,722[ c]
32.81%
5,248
Franklin
2,239
40.02%
2,424
43.32%
671
11.99%
213
3.81%
48
0.86%
-185
-3.31%
5,595
Gasconade
518
19.84%
1,539
58.94%
495
18.96%
25
0.96%
34
1.30%
-1,021
-39.10%
2,611
Gentry
2,268
54.25%
1,268
30.33%
524
12.53%
56
1.34%
65
1.55%
1,000
23.92%
4,181
Greene
5,089
40.52%
4,350
34.63%
2,184
17.39%
758
6.04%
179
1.43%
739
5.88%
12,560
Grundy
1,310
33.44%
1,051
26.83%
1,484
37.89%
24
0.61%
48
1.23%
-174[ a]
-4.44%
3,917
Harrison
1,985
38.62%
2,081
40.49%
965
18.77%
37
0.72%
72
1.40%
-96
-1.87%
5,140
Henry
3,396
53.78%
1,162
18.40%
1,500
23.75%
132
2.09%
125
1.98%
1,896[ a]
30.02%
6,315
Hickory
421
26.25%
735
45.82%
375
23.38%
58
3.62%
15
0.94%
-314
-19.58%
1,604
Holt
1,519
41.14%
1,522
41.22%
583
15.79%
23
0.62%
45
1.22%
-3
-0.08%
3,692
Howard
2,672
70.48%
896
23.63%
192
5.06%
15
0.40%
16
0.42%
1,776
46.85%
3,791
Howell
1,565
36.45%
1,465
34.12%
836
19.47%
368
8.57%
60
1.40%
100
2.33%
4,294
Iron
845
51.03%
666
40.22%
65
3.93%
55
3.32%
25
1.51%
179
10.81%
1,656
Jackson
32,209
50.97%
5,618
8.89%
23,152
36.64%
1,697
2.69%
518
0.82%
9,057[ a]
14.33%
63,194
Jasper
6,789
40.64%
4,571
27.36%
3,309
19.81%
1,676
10.03%
359
2.15%
2,218
13.28%
16,704
Jefferson
2,368
45.47%
2,127
40.84%
485
9.31%
200
3.84%
28
0.54%
241
4.63%
5,208
Johnson
3,468
52.87%
1,772
27.02%
1,141
17.40%
95
1.45%
83
1.27%
1,696
25.86%
6,559
Knox
1,666
52.99%
1,092
34.73%
297
9.45%
43
1.37%
46
1.46%
574
18.26%
3,144
Laclede
1,634
44.03%
1,478
39.83%
463
12.48%
113
3.05%
23
0.62%
156
4.20%
3,711
Lafayette
3,650
48.93%
2,367
31.73%
1,241
16.64%
157
2.10%
44
0.59%
1,283
17.20%
7,459
Lawrence
2,384
42.45%
1,312
23.36%
1,536
27.35%
311
5.54%
73
1.30%
848[ a]
15.10%
5,616
Lewis
2,340
62.27%
1,004
26.72%
334
8.89%
47
1.25%
33
0.88%
1,336
35.55%
3,758
Lincoln
2,326
61.32%
1,258
33.17%
167
4.40%
10
0.26%
32
0.84%
1,068
28.16%
3,793
Linn
2,890
48.13%
1,452
24.18%
1,434
23.88%
131
2.18%
97
1.62%
1,438
23.95%
6,004
Livingston
2,314
48.04%
885
18.37%
1,502
31.18%
58
1.20%
58
1.20%
812[ a]
16.86%
4,817
Macon
3,610
51.68%
1,288
18.44%
1,830
26.20%
171
2.45%
86
1.23%
1,780[ a]
25.48%
6,985
Madison
1,126
51.18%
827
37.59%
171
7.77%
53
2.41%
23
1.05%
299
13.59%
2,200
Maries
1,096
63.39%
448
25.91%
128
7.40%
39
2.26%
18
1.04%
648
37.48%
1,729
Marion
3,471
58.74%
1,693
28.65%
531
8.99%
125
2.12%
89
1.51%
1,778
30.09%
5,909
McDonald
1,326
46.06%
916
31.82%
442
15.35%
157
5.45%
38
1.32%
410
14.24%
2,879
Mercer
780
27.34%
995
34.88%
996
34.91%
42
1.47%
40
1.40%
-1[ b]
-0.04%
2,853
Miller
1,257
39.52%
1,240
38.98%
512
16.10%
143
4.50%
29
0.91%
17
0.53%
3,181
Mississippi
1,388
52.20%
1,050
39.49%
78
2.93%
119
4.48%
24
0.90%
338
12.71%
2,659
Moniteau
1,612
48.76%
1,375
41.59%
215
6.50%
67
2.03%
37
1.12%
237
7.17%
3,306
Monroe
3,586
80.22%
583
13.04%
218
4.88%
64
1.43%
19
0.43%
3,003
67.18%
4,470
Montgomery
1,883
48.54%
1,697
43.75%
219
5.65%
23
0.59%
57
1.47%
186
4.80%
3,879
Morgan
1,163
42.68%
1,239
45.47%
282
10.35%
19
0.70%
22
0.81%
-76
-2.79%
2,725
New Madrid 1,945
43.04%
1,607
35.56%
344
7.61%
564
12.48%
59
1.31%
338
7.48%
4,519
Newton
2,421
44.84%
1,470
27.23%
1,033
19.13%
341
6.32%
134
2.48%
951
17.61%
5,399
Nodaway
3,490
49.49%
2,139
30.33%
1,307
18.53%
49
0.69%
67
0.95%
1,351
19.16%
7,052
Oregon
1,688
62.94%
486
18.12%
333
12.42%
164
6.11%
11
0.41%
1,202
44.82%
2,682
Osage
1,394
47.69%
981
33.56%
485
16.59%
29
0.99%
34
1.16%
413
14.13%
2,923
Ozark
575
27.05%
695
32.69%
787
37.02%
50
2.35%
19
0.89%
-92[ b]
-4.33%
2,126
Pemiscot
1,617
51.11%
973
30.75%
283
8.94%
259
8.19%
32
1.01%
644
20.35%
3,164
Perry
1,564
45.85%
1,735
50.86%
86
2.52%
15
0.44%
11
0.32%
-171
-5.01%
3,411
Pettis
3,771
47.12%
2,423
30.28%
1,512
18.89%
210
2.62%
87
1.09%
1,348
16.84%
8,003
Phelps
1,565
55.58%
782
27.77%
379
13.46%
63
2.24%
27
0.96%
783
27.81%
2,816
Pike
2,720
56.01%
1,901
39.15%
176
3.62%
32
0.66%
27
0.56%
819
16.87%
4,856
Platte
2,535
73.58%
510
14.80%
375
10.89%
11
0.32%
14
0.41%
2,025
58.78%
3,445
Polk
1,935
41.92%
1,802
39.04%
754
16.33%
81
1.75%
44
0.95%
133
2.88%
4,616
Pulaski
1,268
56.66%
631
28.19%
267
11.93%
40
1.79%
32
1.43%
637
28.46%
2,238
Putnam
933
27.96%
1,859
55.71%
420
12.59%
64
1.92%
61
1.83%
-926
-27.75%
3,337
Ralls
1,734
67.13%
591
22.88%
240
9.29%
8
0.31%
10
0.39%
1,143
44.25%
2,583
Randolph
4,186
68.18%
1,126
18.34%
641
10.44%
119
1.94%
68
1.11%
3,060
49.84%
6,140
Ray
3,042
61.70%
1,192
24.18%
561
11.38%
80
1.62%
55
1.12%
1,850
37.53%
4,930
Reynolds
1,030
62.27%
367
22.19%
169
10.22%
77
4.66%
11
0.67%
663
40.08%
1,654
Ripley
1,249
51.17%
651
26.67%
353
14.46%
157
6.43%
31
1.27%
598
24.50%
2,441
Saint Charles 1,792
37.36%
2,350
49.00%
525
10.95%
105
2.19%
24
0.50%
-558
-11.63%
4,796
Saint Clair 1,710
46.00%
1,046
28.14%
727
19.56%
190
5.11%
44
1.18%
664
17.86%
3,717
Saint Francois 2,786
44.76%
2,305
37.03%
344
5.53%
732
11.76%
58
0.93%
481
7.73%
6,225
Saint Louis County 5,409
34.84%
6,177
39.78%
2,854
18.38%
929
5.98%
157
1.01%
-768
-4.95%
15,526
Saint Louis City 58,845
41.93%
46,509
33.14%
24,746
17.63%
9,159
6.53%
1,068
0.76%
12,336
8.79%
140,327
Sainte Genevieve 1,138
49.22%
1,100
47.58%
47
2.03%
19
0.82%
8
0.35%
38
1.64%
2,312
Saline
3,929
57.01%
1,443
20.94%
1,413
20.50%
41
0.59%
66
0.96%
2,486
36.07%
6,892
Schuyler
1,218
54.35%
766
34.18%
193
8.61%
30
1.34%
34
1.52%
452
20.17%
2,241
Scotland
1,525
53.34%
860
30.08%
379
13.26%
65
2.27%
30
1.05%
665
23.26%
2,859
Scott
1,945
46.45%
1,235
29.50%
303
7.24%
649
15.50%
55
1.31%
710
16.96%
4,187
Shannon
1,110
52.98%
385
18.38%
376
17.95%
193
9.21%
31
1.48%
725
34.61%
2,095
Shelby
2,450
65.51%
859
22.97%
331
8.85%
33
0.88%
67
1.79%
1,591
42.54%
3,740
Stoddard
2,603
49.54%
1,363
25.94%
586
11.15%
648
12.33%
54
1.03%
1,240
23.60%
5,254
Stone
506
22.18%
946
41.47%
642
28.15%
165
7.23%
22
0.96%
304[ b]
13.33%
2,281
Sullivan
2,226
47.35%
1,819
38.69%
576
12.25%
43
0.91%
37
0.79%
407
8.66%
4,701
Taney
588
32.98%
852
47.78%
259
14.53%
72
4.04%
12
0.67%
-264
-14.81%
1,783
Texas
2,067
51.30%
1,232
30.58%
553
13.73%
129
3.20%
48
1.19%
835
20.72%
4,029
Vernon
3,483
55.94%
1,654
26.57%
655
10.52%
323
5.19%
111
1.78%
1,829
29.38%
6,226
Warren
431
21.09%
1,067
52.20%
499
24.41%
36
1.76%
11
0.54%
568[ b]
27.79%
2,044
Washington
1,121
43.69%
1,059
41.27%
307
11.96%
53
2.07%
26
1.01%
62
2.42%
2,566
Wayne
1,432
48.26%
1,052
35.46%
304
10.25%
152
5.12%
27
0.91%
380
12.81%
2,967
Webster
1,649
42.12%
1,387
35.43%
744
19.00%
82
2.09%
53
1.35%
262
6.69%
3,915
Worth
973
49.49%
769
39.11%
183
9.31%
6
0.31%
35
1.78%
204
10.38%
1,966
Wright
1,356
38.45%
1,163
32.97%
895
25.38%
86
2.44%
27
0.77%
193
5.47%
3,527
Totals
330,746
47.35%
207,821
29.75%
124,375
17.80%
28,466
4.07%
7,158
1.02%
122,925
17.60%
698,566
See also
Notes
^ a b c d e f g h i In this county where Taft finished third behind Roosevelt, margin given is Wilson vote minus Roosevelt vote and percentage margin Wilson percentage minus Roosevelt percentage.
^ a b c d e f In this county where Wilson finished third behind both Taft and Roosevelt, margin given is Taft vote minus Roosevelt vote and percentage margin Taft percentage minus Roosevelt percentage.
^ In this county where Debs ran second ahead of both Roosevelt and Taft, margin given is Wilson vote minus Debs vote and percentage margin Wilson percentage minus Debs percentage.
References


