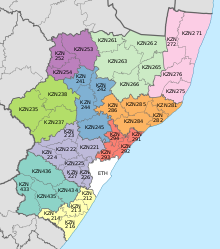
Big Five Hlabisa Local Municipality elections Aspect of politics in KwaZulu-Natal, South Africa
The Big Five Hlabisa Local Municipality council consists of twenty-seven members elected by mixed-member proportional representation . Fourteen councillors are elected by first-past-the-post voting in fourteen wards , while the remaining thirteen are chosen from party lists so that the total number of party representatives is proportional to the number of votes received.
It was established for the August 2016 local elections by the merging of The Big 5 False Bay and Hlabisa local municipalities.[ 1]
In the election of 3 August 2016 the Inkatha Freedom Party (IFP) won a majority of thirteen seats on the council. In 2021 the IFP won an increased majority of fifteen.
Results
The following table shows the composition of the council and its predecessors after past elections.
The Big Five False Bay
Hlabisa
Big Five Hlabisa
December 2000 election
The following table shows the results of the 2000 election.[ 2] [ 3]
The Big Five False Bay
Party Ward List Total Votes % Seats Votes % Seats Inkatha Freedom Party 4,064 80.30 4 4,017 79.81 2 6 African National Congress 997 19.70 0 1,016 20.19 1 1 Total 5,061 100.00 4 5,033 100.00 3 7 Valid votes 5,061 96.81 5,033 96.58 Invalid/blank votes 167 3.19 178 3.42 Total votes 5,228 100.00 5,211 100.00 Registered voters/turnout 8,889 58.81 8,889 58.62
Hlabisa
Party Ward List Total Votes % Seats Votes % Seats Inkatha Freedom Party 28,710 92.16 19 30,555 92.00 15 34 African National Congress 2,444 7.84 0 2,656 8.00 3 3 Total 31,154 100.00 19 33,211 100.00 18 37 Valid votes 31,154 97.85 33,211 97.86 Invalid/blank votes 684 2.15 725 2.14 Total votes 31,838 100.00 33,936 100.00 Registered voters/turnout 67,804 46.96 67,804 50.05
March 2006 election
The following table shows the results of the 2006 election.[ 4] [ 5]
The Big Five False Bay
Party Ward List Total Votes % Seats Votes % Seats Inkatha Freedom Party 5,064 67.48 4 5,009 66.93 1 5 African National Congress 2,080 27.71 0 2,124 28.38 2 2 National Democratic Convention 177 2.36 0 195 2.61 0 0 Democratic Alliance 184 2.45 0 156 2.08 0 0 Total 7,505 100.00 4 7,484 100.00 3 7 Valid votes 7,505 98.71 7,484 98.43 Invalid/blank votes 98 1.29 119 1.57 Total votes 7,603 100.00 7,603 100.00 Registered voters/turnout 13,323 57.07 13,323 57.07
Hlabisa
Party Ward List Total Votes % Seats Votes % Seats Inkatha Freedom Party 30,832 81.30 19 30,765 81.07 11 30 African National Congress 5,871 15.48 0 5,998 15.81 6 6 National Democratic Convention 707 1.86 0 816 2.15 1 1 Democratic Alliance 514 1.36 0 368 0.97 0 0 Total 37,924 100.00 19 37,947 100.00 18 37 Valid votes 37,924 97.62 37,947 98.18 Invalid/blank votes 925 2.38 702 1.82 Total votes 38,849 100.00 38,649 100.00 Registered voters/turnout 70,410 55.18 70,410 54.89
May 2011 election
The following table shows the results of the 2011 election.[ 6] [ 7]
The Big Five False Bay
Party Ward List Total Votes % Seats Votes % Seats African National Congress 4,252 42.52 2 4,334 43.34 1 3 Inkatha Freedom Party 4,062 40.62 2 4,110 41.10 1 3 National Freedom Party 1,526 15.26 0 1,458 14.58 1 1 African Christian Democratic Party 159 1.59 0 98 0.98 0 0 Total 9,999 100.00 4 10,000 100.00 3 7 Valid votes 9,999 98.36 10,000 98.32 Invalid/blank votes 167 1.64 171 1.68 Total votes 10,166 100.00 10,171 100.00 Registered voters/turnout 16,239 62.60 16,239 62.63
Hlabisa
In 2011 a substantial part of the Hlabisa municipality's land area, including more than half of its population, was transferred to the Mtubatuba Local Municipality . Consequently, the council was reduced from 37 seats to 16 seats.
Party Ward List Total Votes % Seats Votes % Seats Inkatha Freedom Party 8,573 47.06 6 8,502 46.64 2 8 African National Congress 5,052 27.73 1 5,076 27.85 3 4 National Freedom Party 4,559 25.02 1 4,561 25.02 3 4 Democratic Alliance 35 0.19 0 90 0.49 0 0 Total 18,219 100.00 8 18,229 100.00 8 16 Valid votes 18,219 98.23 18,229 98.29 Invalid/blank votes 329 1.77 318 1.71 Total votes 18,548 100.00 18,547 100.00 Registered voters/turnout 28,299 65.54 28,299 65.54
August 2016 election
The Big Five False Bay and Hlabisa municipalities were merged at the time of the 2016 election. The following table shows the results of the election.[ 8]
Party Ward List Total Votes % Seats Votes % Seats Inkatha Freedom Party 17,758 51.77 8 18,125 52.73 5 13 African National Congress 14,743 42.98 5 14,999 43.63 6 11 Democratic Alliance 769 2.24 0 775 2.25 1 1 Economic Freedom Fighters 603 1.76 0 475 1.38 0 0 Independent candidates 430 1.25 0 0 Total 34,303 100.00 13 34,374 100.00 12 25 Valid votes 34,303 98.31 34,374 98.47 Invalid/blank votes 591 1.69 535 1.53 Total votes 34,894 100.00 34,909 100.00 Registered voters/turnout 54,748 63.74 54,748 63.76
November 2021 election
The following table shows the results of the 2021 election.[ 9]
Party Ward List Total Votes % Seats Votes % Seats Inkatha Freedom Party 16,908 53.93 13 17,968 57.25 2 15 African National Congress 10,206 32.56 0 10,602 33.78 9 9 Economic Freedom Fighters 1,043 3.33 0 1,093 3.48 1 1 Independent candidates 1,701 5.43 1 1 National Freedom Party 665 2.12 0 630 2.01 1 1 Democratic Alliance 338 1.08 0 360 1.15 0 0 KZN Independence 211 0.67 0 392 1.25 0 0 Independent Alliance 130 0.41 0 183 0.58 0 0 African Christian Democratic Party 56 0.18 0 45 0.14 0 0 Abantu Batho Congress 56 0.18 0 42 0.13 0 0 United Christian Democratic Party 32 0.10 0 39 0.12 0 0 African Transformation Movement 3 0.01 0 29 0.09 0 0 Total 31,349 100.00 14 31,383 100.00 13 27 Valid votes 31,349 98.51 31,383 98.57 Invalid/blank votes 475 1.49 455 1.43 Total votes 31,824 100.00 31,838 100.00 Registered voters/turnout 56,212 56.61 56,212 56.64
References
