|
Hlabisa Local Municipality
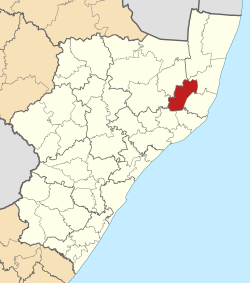
Hlabisa was an administrative area in the Umkhanyakude District of KwaZulu-Natal in South Africa. Hlabisa is an isiZulu surname of the two nkosis (kings) in the area. The municipality was situated within the vicinity of four Tribal Authorities which are the Mkhwanazi Tribal Authority, the Mdletshe Tribal Authority, and two Hlabisa Tribal Authorities.[3] The municipality was generally characterised by isolated rural communities with high levels of poverty. The most significant land use was subsistence agriculture and dispersed settlements, plantations and agriculture are found throughout the municipality. The major draw card of Hlabisa was the tourism industry centred on the adjacent game reserve.[4] After municipal elections on 3 August 2016 it was merged into the larger Big Five Hlabisa Local Municipality. Main placesThe 2001 census divided the municipality into the following main places:[5]
PoliticsThe municipal council consisted of sixteen members elected by mixed-member proportional representation. Eight councillors were elected by first-past-the-post voting in eight wards, while the remaining eight were chosen from party lists so that the total number of party representatives was proportional to the number of votes received. In the election of 18 May 2011 no party obtained a majority. The following table shows the results of the election.[6][7] The National Freedom Party lost a ward to the Inkatha Freedom Party in a by-election in December 2012. As a result, the IFP gained a majority of 9 seats on the council.[8]
References
External links
|
||||||||||||||||||||||||||||||||||||||||||||||||||||||||||||||||||||||||||||||||||||||||||||||||||||||||||||||||||||||||||||||||||||||||||||||||||||


