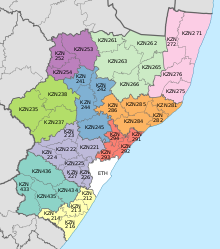
Mtubatuba Local Municipality elections
The Mtubatuba Local Municipality council consists of forty-five members elected by mixed-member proportional representation . Twenty-three councillors are elected by first-past-the-post voting in twenty-three wards , while the remaining twenty-two are chosen from party lists so that the total number of party representatives is proportional to the number of votes received.
In the election of 1 November 2021 no party obtained a majority. The Inkatha Freedom Party (IFP) received the most seats with nineteen.
Results
The following table shows the composition of the council after past elections.
December 2000 election
The following table shows the results of the 2000 election.[ 1]
Party Ward List Total Votes % Seats Votes % Seats Inkatha Freedom Party 3,222 66.08 5 3,244 66.48 2 7 African National Congress 911 18.68 0 920 18.85 2 2 Democratic Alliance 589 12.08 0 604 12.38 1 1 African Christian Democratic Party 90 1.85 0 112 2.30 0 0 Independent candidates 64 1.31 0 0 Total 4,876 100.00 5 4,880 100.00 5 10 Valid votes 4,876 97.95 4,880 98.03 Invalid/blank votes 102 2.05 98 1.97 Total votes 4,978 100.00 4,978 100.00 Registered voters/turnout 13,768 36.16 13,768 36.16
March 2006 election
The following table shows the results of the 2006 election.[ 2]
Party Ward List Total Votes % Seats Votes % Seats Inkatha Freedom Party 3,469 49.35 4 3,464 49.23 1 5 African National Congress 2,545 36.20 1 2,627 37.33 3 4 National Democratic Convention 501 7.13 0 479 6.81 1 1 Democratic Alliance 369 5.25 0 467 6.64 0 0 Independent candidates 146 2.08 0 0 Total 7,030 100.00 5 7,037 100.00 5 10 Valid votes 7,030 97.27 7,037 97.36 Invalid/blank votes 197 2.73 191 2.64 Total votes 7,227 100.00 7,228 100.00 Registered voters/turnout 17,431 41.46 17,431 41.47
May 2011 election
The following table shows the results of the 2011 election.[ 3]
Party Ward List Total Votes % Seats Votes % Seats African National Congress 17,476 40.59 10 17,718 41.14 6 16 Inkatha Freedom Party 17,290 40.15 9 17,057 39.60 6 15 National Freedom Party 7,554 17.54 0 7,204 16.73 7 7 Democratic Alliance 83 0.19 0 790 1.83 0 0 South African Democratic Congress 324 0.75 0 186 0.43 0 0 Independent candidates 227 0.53 0 0 African Christian Democratic Party 105 0.24 0 114 0.26 0 0 Total 43,059 100.00 19 43,069 100.00 19 38 Valid votes 43,059 98.33 43,069 98.47 Invalid/blank votes 730 1.67 669 1.53 Total votes 43,789 100.00 43,738 100.00 Registered voters/turnout 73,367 59.68 73,367 59.62
August 2016 election
The following table shows the results of the 2016 election.[ 4]
Party Ward List Total Votes % Seats Votes % Seats Inkatha Freedom Party 24,558 44.63 10 24,812 45.08 8 18 African National Congress 24,180 43.94 10 24,219 44.01 8 18 Democratic Alliance 2,118 3.85 0 2,089 3.80 2 2 Economic Freedom Fighters 1,969 3.58 0 1,964 3.57 1 1 African Independent Congress 1,237 2.25 0 1,769 3.21 1 1 Independent candidates 962 1.75 0 0 Peoples Alliance 1 0.00 0 181 0.33 0 0 Total 55,025 100.00 20 55,034 100.00 20 40 Valid votes 55,025 97.57 55,034 97.31 Invalid/blank votes 1,368 2.43 1,522 2.69 Total votes 56,393 100.00 56,556 100.00 Registered voters/turnout 90,718 62.16 90,718 62.34
August 2016 to November 2021 by-elections
In a by-election held on 23 May 2018, a ward previously held by an ANC councillor was won by the IFP candidate.[ 5] [ 6] [ 7]
November 2021 election
The following table shows the results of the 2021 election.[ 8]
Party Ward List Total Votes % Seats Votes % Seats Inkatha Freedom Party 23,138 40.72 15 25,053 44.16 4 19 African National Congress 19,903 35.03 7 20,949 36.92 9 16 Economic Freedom Fighters 5,148 9.06 0 5,146 9.07 4 4 Independent candidates 3,202 5.63 1 1 African Christian Democratic Party 1,192 2.10 0 1,263 2.23 1 1 Democratic Alliance 1,065 1.87 0 1,119 1.97 1 1 African Independent Congress 656 1.15 0 588 1.04 1 1 United Democratic Movement 533 0.94 0 531 0.94 1 1 National Freedom Party 493 0.87 0 494 0.87 1 1 United Christian Democratic Party 502 0.88 0 457 0.81 0 0 African People's Movement 281 0.49 0 325 0.57 0 0 African People's Convention 164 0.29 0 227 0.40 0 0 Abantu Batho Congress 186 0.33 0 159 0.28 0 0 Al Jama-ah 99 0.17 0 95 0.17 0 0 Democratic Union Plus 111 0.20 0 81 0.14 0 0 African Transformation Movement 89 0.16 0 102 0.18 0 0 Black First Land First 34 0.06 0 50 0.09 0 0 National People's Front 19 0.03 0 60 0.11 0 0 Patriotic Alliance 10 0.02 0 37 0.07 0 0 Total 56,825 100.00 23 56,736 100.00 22 45 Valid votes 56,825 98.07 56,736 98.04 Invalid/blank votes 1,118 1.93 1,133 1.96 Total votes 57,943 100.00 57,869 100.00 Registered voters/turnout 101,008 57.36 101,008 57.29
By-elections from November 2021
The following by-elections were held to fill vacant ward seats in the period since the election in November 2021.[ 9]
In ward 9, narrowly held by the African National Congress (ANC) in 2021, the councillor resigned. The ANC failed to register a candidate in time for the resulting by-election, and the Inkatha Freedom Party (IFP) picked up the seat with 77% of the vote, solidifying their coalition in the council.[ 11]
In ward 4, after the ANC councillor's resignation, the IFP won the resulting by-election.[ 12]
References
