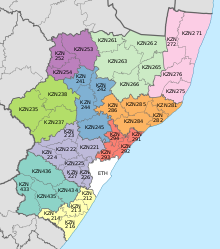
Nquthu Local Municipality elections Elections in Nquthu, South Africa
The Nquthu Local Municipality council consists of thirty-seven members elected by mixed-member proportional representation . Nineteen councillors are elected by first-past-the-post voting in nineteen wards , while the remaining eighteen are chosen from party lists so that the total number of party representatives is proportional to the number of votes received.
In the election of 1 November 2021 the IFP won a majority of nineteen seats.
Results
The following table shows the composition of the council after past elections.
December 2000 election
The following table shows the results of the 2000 election.[ 1]
Party Ward List Total Votes % Seats Votes % Seats Inkatha Freedom Party 17,921 78.00 13 18,769 81.70 7 20 African National Congress 3,151 13.71 0 3,307 14.40 4 4 Democratic Alliance 628 2.73 0 897 3.90 1 1 Independent candidates 1,277 5.56 0 0 Total 22,977 100.00 13 22,973 100.00 12 25 Valid votes 22,977 97.59 22,973 97.67 Invalid/blank votes 567 2.41 549 2.33 Total votes 23,544 100.00 23,522 100.00 Registered voters/turnout 45,302 51.97 45,302 51.92
March 2006 election
The following table shows the results of the 2006 election.[ 2]
Party Ward List Total Votes % Seats Votes % Seats Inkatha Freedom Party 23,660 74.53 14 23,429 73.81 8 22 African National Congress 5,908 18.61 1 6,026 18.98 5 6 National Democratic Convention 1,136 3.58 0 1,169 3.68 1 1 Democratic Alliance 1,043 3.29 0 1,118 3.52 1 1 Total 31,747 100.00 15 31,742 100.00 15 30 Valid votes 31,747 97.91 31,742 97.84 Invalid/blank votes 679 2.09 702 2.16 Total votes 32,426 100.00 32,444 100.00 Registered voters/turnout 58,210 55.71 58,210 55.74
May 2011 election
The following table shows the results of the 2011 election.[ 3]
Party Ward List Total Votes % Seats Votes % Seats African National Congress 15,648 39.50 7 16,374 41.21 7 14 Inkatha Freedom Party 15,910 40.16 8 15,886 39.99 6 14 National Freedom Party 6,513 16.44 2 6,372 16.04 3 5 Democratic Alliance 706 1.78 0 620 1.56 1 1 Independent candidates 486 1.23 0 0 African Christian Democratic Party 206 0.52 0 175 0.44 0 0 Royal Loyal Progress 80 0.20 0 185 0.47 0 0 Federal Congress 65 0.16 0 117 0.29 0 0 Total 39,614 100.00 17 39,729 100.00 17 34 Valid votes 39,614 98.36 39,729 98.14 Invalid/blank votes 662 1.64 754 1.86 Total votes 40,276 100.00 40,483 100.00 Registered voters/turnout 65,776 61.23 65,776 61.55
August 2016 election
The following table shows the results of the 2016 election.[ 4]
Party Ward List Total Votes % Seats Votes % Seats Inkatha Freedom Party 19,099 43.60 10 19,554 44.59 5 15 African National Congress 17,821 40.68 7 19,018 43.37 7 14 National Freedom Party 2,203 5.03 0 3,021 6.89 2 2 Economic Freedom Fighters 1,321 3.02 0 1,313 2.99 1 1 Independent candidates 2,479 5.66 0 0 Democratic Alliance 884 2.02 0 948 2.16 1 1 Total 43,807 100.00 17 43,854 100.00 16 33 Valid votes 43,807 98.04 43,854 97.93 Invalid/blank votes 878 1.96 929 2.07 Total votes 44,685 100.00 44,783 100.00 Registered voters/turnout 77,097 57.96 77,097 58.09
February 2017 special election
By February 2017, the Nquthu Local Municipality had failed to form a council and appoint a mayor.[ 5] KwaZulu-Natal Cooperative Governance and Traditional Affairs MEC Nomusa Dube-Ncube dissolved the then elected members positions on 9 February 2017, effective from 23 February with elections to be held 25 May 2017.[ 5] [ 5] [ 5]
In the special election held on 25 May 2017, the IFP won a majority of 58% of the vote and 19 seats on the council. The following table shows the results of the election.[ 6]
Party
Votes
Seats
Ward
List
Total
%
Ward
List
Total
Inkatha Freedom Party
27,768
28,086
55,854
58.0
14
5
19
African National Congress
15,751
15,735
31,486
32.7
3
8
11
Economic Freedom Fighters
1,354
1,272
2,626
2.7
0
1
1
National Freedom Party
1,075
1,039
2,114
2.2
0
1
1
DA
586
579
1,165
1.2
0
1
1
AIC
489
414
903
0.9
0
0
0
Forum 4 Service Delivery
311
268
579
0.6
0
0
0
APC
161
172
333
0.3
0
0
0
Black First Land First
144
114
258
0.3
0
0
0
National Religious Freedom Party
131
122
253
0.3
0
0
0
Academic Congress Union
98
100
198
0.2
0
0
0
National Peoples Ambassadors
109
82
191
0.2
0
0
0
National Democratic Convention
88
57
145
0.2
0
0
0
African Mantungwa Community
69
51
120
0.1
0
0
0
Total
48,134 48,091 96,225 100.0 17 16 33
Spoilt votes
610
633
1,243
November 2021 election
The following table shows the results of the 2021 election.[ 7]
Party Ward List Total Votes % Seats Votes % Seats Inkatha Freedom Party 20,789 49.25 14 21,665 51.03 5 19 African National Congress 15,222 36.06 5 15,385 36.23 9 14 Abantu Batho Congress 3,030 7.18 0 2,955 6.96 3 3 Economic Freedom Fighters 741 1.76 0 779 1.83 1 1 Independent candidates 704 1.67 0 0 Democratic Alliance 355 0.84 0 342 0.81 0 0 National Freedom Party 298 0.71 0 312 0.73 0 0 Future Generation Congress 223 0.53 0 190 0.45 0 0 African Christian Democratic Party 169 0.40 0 195 0.46 0 0 National Peoples Ambassadors 126 0.30 0 140 0.33 0 0 African Transformation Movement 135 0.32 0 103 0.24 0 0 African People's Movement 115 0.27 0 108 0.25 0 0 People's Freedom Party 112 0.27 0 87 0.20 0 0 Forum for Service Delivery 77 0.18 0 79 0.19 0 0 African Mantungwa Community 73 0.17 0 68 0.16 0 0 United Christian Democratic Party 42 0.10 0 51 0.12 0 0 Total 42,211 100.00 19 42,459 100.00 18 37 Valid votes 42,211 98.61 42,459 98.52 Invalid/blank votes 593 1.39 637 1.48 Total votes 42,804 100.00 43,096 100.00 Registered voters/turnout 80,324 53.29 80,324 53.65
References
