2004 UK local government election
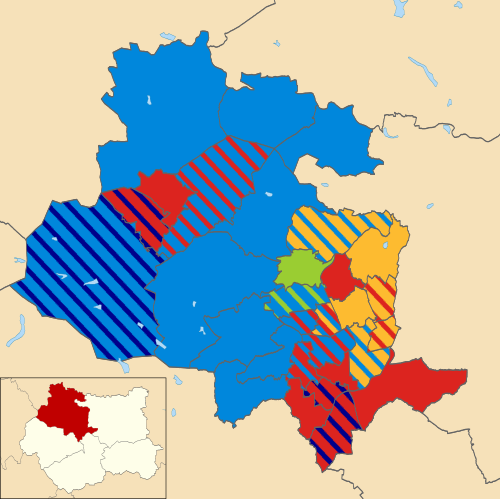 Map of the results of the 2004 Bradford Council election. Conservatives in blue, Labour in red, Liberal Democrats in yellow, Green in green and BNP in navy blue.
Elections to City of Bradford Metropolitan District Council were held on 10 June 2004. The whole council was up for election following boundary changes. The council stayed under no overall control.[1][2]
Election result
Bradford Local Election Result 2004[1]
| Party
|
Seats
|
Gains
|
Losses
|
Net gain/loss
|
Seats %
|
Votes %
|
Votes
|
+/−
|
|
|
Conservative
|
38
|
0
|
0
|

|
42.2
|
31.7
|
54,339
|
N/A
|
|
|
Labour
|
29
|
0
|
0
|
|
32.2
|
26.9
|
46,135
|
N/A
|
|
|
Liberal Democrats
|
15
|
0
|
0
|
|
16.7
|
23.3
|
40,012
|
N/A
|
|
|
Green
|
4
|
0
|
0
|
|
4.4
|
7.1
|
12,250
|
N/A
|
|
|
BNP
|
4
|
0
|
0
|
|
4.4
|
7.0
|
12,079
|
N/A
|
|
|
Independent
|
0
|
0
|
0
|
|
0.0
|
3.0
|
5,170
|
N/A
|
|
|
UKIP
|
0
|
0
|
0
|
|
0.0
|
0.9
|
1,487
|
N/A
|
This result had the following consequences for the total number of seats on the council after the elections:
| Party
|
Previous council
|
New council
|
|
|
Conservative
|
36
|
38
|
|
|
Labour
|
36
|
29
|
|
|
Liberal Democrat
|
14
|
15
|
|
|
Green
|
3
|
4
|
|
|
BNP
|
4
|
4
|
|
|
Independent
|
1
|
0
|
| Total
|
90
|
90
|
| Working majority
|
-18
|
-14
|
Ward results
By-elections between 2004 and 2006
References


