2000 UK local government election
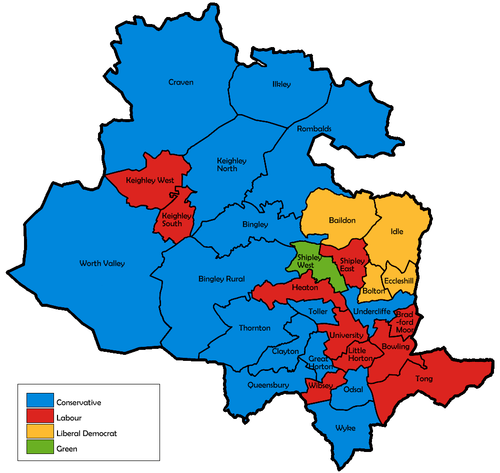 Map of the results for the 2000 Bradford council election.
The 2000 City of Bradford Metropolitan District Council elections were held on Thursday, 4 May 2000, with one third of the council up for election. Labour lost control of the council to no overall control.[1][2]
Election results
Bradford Local Election Result 2000[1]
| Party
|
Seats
|
Gains
|
Losses
|
Net gain/loss
|
Seats %
|
Votes %
|
Votes
|
+/−
|
|
|
Conservative
|
15
|
11
|
0
|
 11 11
|
50.0
|
43.7
|
45,422
|
+4.0
|
|
|
Labour
|
10
|
0
|
13
|
 13 13
|
33.3
|
34.4
|
35,729
|
-3.9
|
|
|
Liberal Democrats
|
4
|
1
|
0
|
1
|
13.3
|
15.5
|
16,094
|
-1.3
|
|
|
Green
|
1
|
1
|
0
|
1
|
3.3
|
3.3
|
3,410
|
+0.7
|
|
|
Independent
|
0
|
0
|
0
|

|
0.0
|
2.9
|
2,980
|
+0.4
|
|
|
Asian League
|
0
|
0
|
0
|
|
0.0
|
0.2
|
195
|
+0.2
|
|
|
Socialist Alternative
|
0
|
0
|
0
|
|
0.0
|
0.1
|
97
|
+0.1
|
This result had the following consequences for the total number of seats on the council after the elections:
| Party
|
Previous council
|
New council
|
|
|
Labour
|
54
|
41
|
|
|
Conservative
|
26
|
37
|
|
|
Liberal Democrat
|
10
|
11
|
|
|
Green
|
0
|
1
|
| Total
|
90
|
90
|
| Working majority
|
18
|
-8
|
Ward results
By-elections between 2000 and 2002
References


