Place in KwaZulu-Natal, South Africa
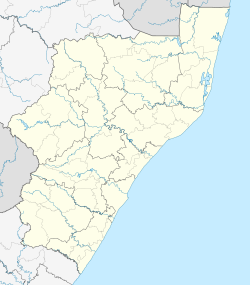
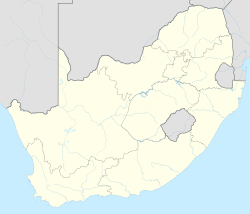
Van Reenen is a settlement in Uthukela District Municipality in the KwaZulu-Natal province of South Africa.
It is located on the N3 national road at the top of Van Reenen's Pass on the Great Escarpment of the Drakensberg. The town is named after Frans van Reenen, original owner of the farm where Van Reenen was established and planner of the route of the Van Reenen's Pass.[2]
Llandaff Oratory, an eight-seat memorial church built around 1925, is a Heritage Landmark.
The Moorddraai ('Murder corner' in Afrikaans) memorial a few kilometres to the south-east of the town marks the place where nine people transporting goods from Durban were killed by Basotho tribesmen in 1865.
Gallery
Climate
| Climate data for Van Reenan, elevation 1,680 m (5,510 ft), (1991–2020 normals, extremes 1998–2023)
|
| Month
|
Jan
|
Feb
|
Mar
|
Apr
|
May
|
Jun
|
Jul
|
Aug
|
Sep
|
Oct
|
Nov
|
Dec
|
Year
|
| Record high °C (°F)
|
36.7
(98.1)
|
32.4
(90.3)
|
32.5
(90.5)
|
34.6
(94.3)
|
30.0
(86.0)
|
26.9
(80.4)
|
28.9
(84.0)
|
31.1
(88.0)
|
34.8
(94.6)
|
33.9
(93.0)
|
34.2
(93.6)
|
35.7
(96.3)
|
36.7
(98.1)
|
| Mean daily maximum °C (°F)
|
26.3
(79.3)
|
25.6
(78.1)
|
25.0
(77.0)
|
22.5
(72.5)
|
20.8
(69.4)
|
18.6
(65.5)
|
18.4
(65.1)
|
21.3
(70.3)
|
24.9
(76.8)
|
25.2
(77.4)
|
25.4
(77.7)
|
26.8
(80.2)
|
23.4
(74.1)
|
| Daily mean °C (°F)
|
19.9
(67.8)
|
19.6
(67.3)
|
18.4
(65.1)
|
15.5
(59.9)
|
12.5
(54.5)
|
10.3
(50.5)
|
9.7
(49.5)
|
12.5
(54.5)
|
16.1
(61.0)
|
17.5
(63.5)
|
18.0
(64.4)
|
20.0
(68.0)
|
15.8
(60.5)
|
| Mean daily minimum °C (°F)
|
13.5
(56.3)
|
13.5
(56.3)
|
11.8
(53.2)
|
8.5
(47.3)
|
4.1
(39.4)
|
1.9
(35.4)
|
0.9
(33.6)
|
3.8
(38.8)
|
7.3
(45.1)
|
9.8
(49.6)
|
10.7
(51.3)
|
13.1
(55.6)
|
8.2
(46.8)
|
| Record low °C (°F)
|
6.2
(43.2)
|
7.1
(44.8)
|
−0.3
(31.5)
|
−2.4
(27.7)
|
−7.5
(18.5)
|
−7.6
(18.3)
|
−9.5
(14.9)
|
−7.2
(19.0)
|
−6.0
(21.2)
|
0.2
(32.4)
|
1.1
(34.0)
|
5.8
(42.4)
|
−9.5
(14.9)
|
| Average precipitation mm (inches)
|
183.0
(7.20)
|
158.8
(6.25)
|
122.2
(4.81)
|
49.5
(1.95)
|
21.5
(0.85)
|
13.0
(0.51)
|
13.8
(0.54)
|
24.5
(0.96)
|
53.5
(2.11)
|
99.7
(3.93)
|
123.7
(4.87)
|
148.4
(5.84)
|
1,011.6
(39.82)
|
| Average precipitation days (≥ 0.25 mm)
|
1.9
|
1.8
|
1.4
|
0.4
|
0.2
|
0.1
|
0.1
|
0.3
|
0.6
|
0.8
|
1.1
|
1.6
|
10.3
|
| Source: Starlings Roost Weather (precipitation 1913–2023)[3][4]
|
References


