Results of the 2007 Australian federal election in Tasmania

2007 Australian federal election
(Tasmania)

← 2004 24 November 2007 2010 →

All 5 Tasmanian seats in the Australian House of Representatives
and 6 seats in the Australian Senate
  First party Second party
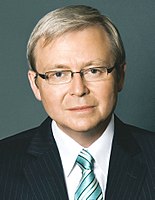
  Kevin Rudd John Howard
Leader Kevin Rudd John Howard
Party Labor Liberal/National coalition
Last election 3 seats 2 seats
Seats won 5 seats 0 seats
Seat change Increase 2 Decrease 2
Popular vote 139,077 124,280
Percentage 42.77% 38.22%
Swing Decrease 1.81 Decrease 3.76
TPP 56.21% 43.79%
TPP swing Increase 2.02 Decrease 2.02

Results by electorate

This is a list of electoral division results for the Australian 2007 federal election in the state of Tasmania.[1][2][3]

Overall results

Turnout 95.76% (CV) — Informal 2.92%[1]
Party Votes % Swing Seats Change
  Labor 139,077 42.77 –1.81 5 Increase 2
  Liberal 124,280 38.22 –3.76 0 Decrease 2
  Greens 43,893 13.50 +3.62
  Family First 7,356 2.26 –0.58
  Citizens Electoral Council 1,856 0.57 +0.20
  Socialist Alliance 859 0.26 –0.09
  Liberty and Democracy Party 606 0.19 +0.19
  Independents 7,215 2.22 +2.22
Total 325,142     5
Two-party-preferred vote
  Labor 182,757 56.21 +2.02 5 Increase 2
  Liberal 142,385 43.79 –2.02 0 Decrease 2
Invalid/blank votes 9,796 2.92 −0.67
Registered voters/turnout 349,753 95.76
Source: Commonwealth Election 2007
Liberal to Labor: Bass, Braddon.[4]

Results by division

Bass

2007 Australian federal election: Bass[3][5]
Party Candidate Votes % ±%
Liberal Michael Ferguson 27,769 43.50 −5.63
Labor Jodie Campbell 23,764 37.23 −1.99
Greens Tom Millen 9,745 15.27 +7.17
Independent Sven Wiener 1,123 1.76 +1.76
Family First Ixa de Haan 930 1.46 −0.37
Liberty & Democracy Shem Bennett 285 0.45 +0.45
Citizens Electoral Council Adrian Watts 219 0.34 −1.02
Total formal votes 63,835 96.75 +0.65
Informal votes 2,142 3.25 −0.65
Turnout 65.977 95.66 +0.03
Two-party-preferred result
Labor Jodie Campbell 32,553 51.00 +3.63
Liberal Michael Ferguson 31,282 49.00 −3.63
Labor gain from Liberal Swing +3.63

Braddon

2007 Australian federal election: Braddon[3][6]
Party Candidate Votes % ±%
Liberal Mark Baker 29,152 44.00 −3.36
Labor Sid Sidebottom 28,948 43.69 +0.64
Greens Paul O'Halloran 5,392 8.14 +2.53
Family First Wayne de Bomford 2,135 3.22 −0.76
Liberty & Democracy Peter Cunningham 321 0.48 +0.48
Citizens Electoral Council Stephen Dick 313 0.47 +0.47
Total formal votes 66,261 96.91 +0.52
Informal votes 2,116 3.09 −0.52
Turnout 68,377 96.28 +0.24
Two-party-preferred result
Labor Sid Sidebottom 34,085 51.44 +2.57
Liberal Mark Baker 32,176 48.56 −2.57
Labor gain from Liberal Swing +2.57

Denison

2007 Australian federal election: Denison[3][7]
Party Candidate Votes % ±%
Labor Duncan Kerr 31,001 48.46 −1.05
Liberal Leigh Gray 18,974 29.66 −2.90
Greens Helen Hutchinson 11,898 18.60 +4.00
Family First Robyn Munro 1,360 2.13 −0.34
Socialist Alliance Susan Austin 494 0.77 −0.08
Citizens Electoral Council Rob Larner 243 0.38 +0.38
Total formal votes 63,970 97.50 +0.61
Informal votes 1,640 2.50 −0.61
Turnout 65,610 95.25 −0.02
Two-party-preferred result
Labor Duncan Kerr 41,982 65.63 +2.34
Liberal Leigh Gray 21,988 34.37 −2.34
Labor hold Swing +2.34

Franklin

2007 Australian federal election: Franklin[3][8]
Party Candidate Votes % ±%
Labor Julie Collins 27,990 41.39 −5.03
Liberal Vanessa Goodwin 27,742 41.02 +2.35
Greens Gerard Velnaar 9,769 14.44 +3.26
Family First Gino Papiccio 1,504 2.22 −0.98
Socialist Alliance Matt Holloway 365 0.53 +0.01
Citizens Electoral Council Roger Honey 262 0.39 +0.39
Total formal votes 67,632 97.28 +0.68
Informal votes 1,893 2.72 −0.68
Turnout 69,525 95.84 +0.19
Two-party-preferred result
Labor Julie Collins 36,845 54.48 −3.11
Liberal Vanessa Goodwin 30,787 45.52 +3.11
Labor hold Swing −3.11

Lyons

2007 Australian federal election: Lyons[3][9]
Party Candidate Votes % ±%
Labor Dick Adams 27,374 43.15 −1.41
Liberal Geoff Page 20,643 32.54 −9.79
Greens Karen Cassidy 7,089 11.17 +1.22
Independent Ben Quin 6,092 9.60 +9.60
Family First Amy Parsons 1,427 2.25 −0.40
Citizens Electoral Council Ray Williams 819 1.29 +0.78
Total formal votes 63,444 96.94 +0.89
Informal votes 2,005 3.06 −0.89
Turnout 65,449 95.72 +0.06
Two-party-preferred result
Labor Dick Adams 37,292 58.78 +5.10
Liberal Geoff Page 26,152 41.22 −5.10
Labor hold Swing +5.10

See also

References

  1. ^ a b "2007 First preference votes for Tasmania". Australian Electoral Commission. Retrieved 4 June 2022.
  2. ^ "2007 Tasmanian division results". Australian Electoral Commission. Retrieved 4 June 2022.
  3. ^ a b c d e f "2007 House of Representatives: Tasmania". Psephos Adam Carr's Election Archive. Retrieved 24 May 2022.
  4. ^ Bennett, Scott; Kopras, Andrew; Newman, Gerrard (2005). "Commonwealth Election 2007" (PDF). Research Paper 30 2007–08. Parliamentary Library. ISSN 1834-9854.
  5. ^ "2007 Bass". 2007 Virtual Tally Room. Australian Electoral Commission. Retrieved 24 May 2022.
  6. ^ "2007 Braddon". 2007 Virtual Tally Room. Australian Electoral Commission. Retrieved 24 May 2022.
  7. ^ "2007 Denison". 2004 Virtual Tally Room. Australian Electoral Commission. Retrieved 24 May 2022.
  8. ^ "2007 Franklin". 2007 Virtual Tally Room. Australian Electoral Commission. Retrieved 24 May 2022.
  9. ^ "2007 Lyons". 2007 Virtual Tally Room. Australian Electoral Commission. Retrieved 24 May 2022.