|
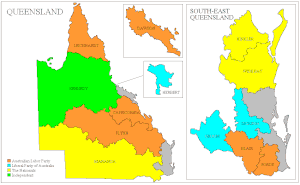
Results of the 2007 Australian federal election in Queensland
2007 Australian federal election
(Queensland)|
|
|
|
|
 Electoral divisions: Queensland
  Electoral divisions: Brisbane area
 |
This is a list of electoral division results for the Australian 2007 federal election in the state of Queensland.[1][2][3]
Overall results
 Electoral divisions: Queensland Electoral divisions: Queensland
 Electoral divisions: Brisbane area Electoral divisions: Brisbane area
Turnout 94.41% (CV) — Informal 3.56%[1]
| Party
|
Votes
|
%
|
Swing
|
Seats
|
Change
|
|
|
Labor
|
1,020,665
|
42.91
|
+8.13
|
15
|
 9 9
|
|
|
|
Liberal
|
818,438
|
34.40
|
–5.01
|
10
|
 7 7
|
|
|
National
|
239,504
|
10.07
|
+0.32
|
3
|
 1 1
|
| Liberal–National coalition
|
1,057,942
|
44.47
|
−4.68
|
13
|
 8 8
|
|
|
Australian Greens
|
133,938
|
5.63
|
+0.57
|
|
|
|
|
Family First
|
54,058
|
2.27
|
–1.40
|
|
|
|
|
Democrats
|
22,427
|
0.94
|
–0.43
|
|
|
|
|
One Nation
|
8,619
|
0.36
|
–1.62
|
|
|
|
|
Citizens Electoral Council
|
3,668
|
0.15
|
–0.21
|
|
|
|
|
Liberty and Democracy Party
|
3,531
|
0.15
|
+0.15
|
|
|
|
|
Socialist Alliance
|
1,174
|
0.05
|
–0.01
|
|
|
|
|
Fishing Party
|
1,010
|
0.04
|
+0.04
|
|
|
|
|
Christian Democrats
|
753
|
0.03
|
+0.03
|
|
|
|
|
Independents
|
71,068
|
2.99
|
–0.20
|
1
|
|
| Total
|
2,378,853
|
|
|
29
|
 1 1
|
| Two-party-preferred vote
|
|
|
Labor
|
1,199,917
|
50.44
|
+7.53
|
15
|
 9 9
|
|
|
Liberal/National coalition
|
1,178,936
|
49.56
|
–7.53
|
13
|
 8 8
|
|
|
| Invalid/blank votes |
87,708 |
3.56 |
−1.60 |
|
|
| Registered voters/turnout |
2,612,504 |
94.41 |
|
|
|
| Source: Commonwealth Election 2007
|
Independents: Bob Katter
Liberal to Labor: Blair, Bonner, Forde, Leichhardt, Longman, Moreton, Petrie
National to Labor: Flynn (notional), Dawson.[4]
Results by division
Blair
Bonner
Bowman
Brisbane
Capricornia
Dawson
Dickson
Fadden
Fairfax
Fisher
Flynn
Forde
Griffith
Groom
Herbert
Hinkler
Kennedy
Leichhardt
Lilley
Longman
Maranoa
McPherson
Moncrieff
Moreton
Oxley
Petrie
Rankin
Ryan
Wide Bay
See also
References
|


