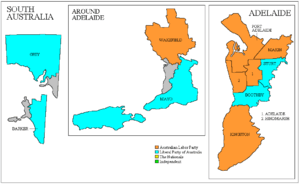
|
Results of the 2007 Australian federal election in South Australia
2007 Australian federal election
(South Australia)|
|
|
|
|
 Electoral divisions: South Australia |
This is a list of electoral division results for the Australian 2007 federal election in the state of South Australia.[1][2][3]
Overall results
Turnout 95.42% (CV) — Informal 3.78%[1]
| Party
|
Votes
|
%
|
Swing
|
Seats
|
Change
|
|
|
Labor
|
426,639
|
43.18
|
+6.43
|
6
|
 3 3
|
|
|
|
Liberal
|
412,621
|
41.76
|
–5.64
|
5
|
 3 3
|
|
|
National
|
12,420
|
1.26
|
+0.24
|
0
|

|
| Liberal–National coalition
|
425,041
|
43.01
|
−5.41
|
5
|
 3 3
|
|
|
Greens
|
68,640
|
6.95
|
+1.51
|
|
|
|
|
Family First
|
40,031
|
4.05
|
–0.26
|
|
|
|
|
Democrats
|
14,957
|
1.51
|
–0.37
|
|
|
|
|
One Nation
|
1,643
|
0.17
|
–0.96
|
|
|
|
|
Liberty and Democracy Party
|
1,637
|
0.17
|
+0.17
|
|
|
|
|
What Women Want
|
1,455
|
0.15
|
+0.15
|
|
|
|
|
Climate Conservatives
|
1,165
|
0.12
|
+0.12
|
|
|
|
|
Independents
|
6,944
|
0.70
|
–1.34
|
|
|
| Total
|
988,152
|
|
|
11
|
|
| Two-party-preferred vote
|
|
|
Labor
|
517,818
|
52.40
|
+6.76
|
6
|
 3 3
|
|
|
Liberal
|
470,334
|
47.60
|
–6.76
|
5
|
 3 3
|
|
|
| Invalid/blank votes |
38,830 |
3.78 |
−1.78 |
|
|
| Registered voters/turnout |
1,076,220 |
95.42 |
|
|
|
| Source: Commonwealth Election 2007
|
Liberal to Labor: Kingston, Makin, Wakefield.[4]
Results by division
Adelaide
Barker
Boothby
Grey
Hindmarsh
Kingston
Makin
Mayo
Port Adelaide
Sturt
Wakefield
See also
References
|


