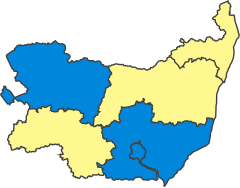
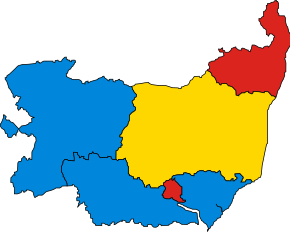
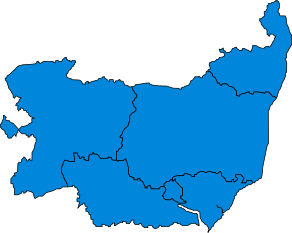
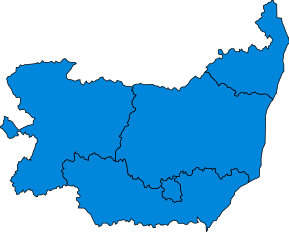
The county of Suffolk in relation to England The county of Suffolk England is divided into 8 parliamentary constituencies (1 borough constituency and 7 county constituencies ). Seven constituencies lie wholly within Suffolk while Waveney Valley straddles the county border between Suffolk and Norfolk .[ nb 1]
Constituencies
† Conservative ‡ Labour ¥ Green
Constituency[ nb 2]
Electorate[ 1]
Majority[ 2] [ nb 3]
Member of Parliament [ 2] Nearest opposition[ 2]
Map
Bury St Edmunds and Stowmarket CC
76,655
1,452
Peter Prinsley ‡
Will Tanner †
Central Suffolk and North Ipswich CC
71,020
4,290
Patrick Spencer †
Kevin Craig ‡
Ipswich BC
75,117
7,403
Jack Abbott ‡
Tom Hunt †
Lowestoft CC
73,967
2,016
Jessica Asato ‡
Peter Aldous †
South Suffolk CC
71,170
3,047
James Cartlidge †
Emma Bishton ‡
Suffolk Coastal CC
72,663
1,070
Jenny Riddell-Carpenter ‡
Thérèse Coffey †
Waveney Valley CC
70,540
5,593
Adrian Ramsay ¥
Richard Rout †
West Suffolk CC
76,243
3,247
Nick Timothy †
Rebecca Denness ‡
Boundary changes
2024
For the 2023 Periodic Review of Westminster constituencies , which redrew the constituency map ahead of the 2024 United Kingdom general election , the Boundary Commission for England opted to combine Suffolk with Norfolk as a sub-region of the East of England region, with the creation of the cross-county boundary constituency of Waveney Valley . The seat of Waveney reverted to its former name of Lowestoft , and Bury St Edmunds was renamed Bury St Edmunds and Stowmarket .[ 3] [ 4] [ 5]
2010
In the Fifth Review the Boundary Commission for England recommended that Suffolk retained its current constituencies, with changes only to reflect revisions to local authority ward boundaries and to reduce the electoral disparity between constituencies. The largest of these changes resulted in the effective transfer of one Borough of Ipswich ward from Central Suffolk and North Ipswich to the constituency of Ipswich.
Results history
Primary data source: House of Commons research briefing - General election results from 1918 to 2019[ 6]
2024
The number of votes cast for each political party who fielded candidates in constituencies comprising Suffolk in the 2024 general election were as follows:[ 2]
Party
Votes
%
Change from 2019
Seats
Change from 2019
Conservative
115,953
30.8%
3
Labour
107,057
28.4%
4
Reform
69,230
18.4%
0
0
Greens
49,925
13.3%
1
Liberal Democrats
31,160
8.3%
-
0
0
Others
3,342
0.9%
-
0
0
Total
376,667
100.0
8
2019
The number of votes cast for each political party who fielded candidates in constituencies comprising Suffolk in the 2019 general election were as follows:
Party
Votes
%
Change from 2017
Seats
Change from 2017
Conservative
229,823
60.1%
7
Labour
91,339
23.9%
0
Liberal Democrats
31,633
8.3%
0
0
Greens
24,490
6.4%
0
0
Brexit
1,432
0.4%
new
0
0
Others
3,432
0.9%
0
0
Total
382,149
100.0
7
Percentage votes
Election year
1918
1922
1923
1924
1929
1931
1935
1945
1950
1951
1955
1959
1964
1966
1970
1974
(Feb)
1974
(Oct)
1979
1983
1987
1992
1997
2001
2005
2010
2015
2017
2019
2024
Conservative 1
48.9
45.6
47.6
54.8
43.6
67.0
62.6
39.7
42.1
49.1
49.6
48.4
45.6
46.6
52.5
44.0
45.5
51.4
52.5
52.5
49.9
37.6
40.7
41.7
46.2
50.7
57.2
60.1
30.8
Labour
12.2
25.8
23.9
20.0
23.3
25.0
32.4
38.2
39.8
43.9
46.6
41.1
38.2
43.2
38.7
31.7
35.1
33.7
22.1
23.2
28.7
40.2
39.7
31.8
21.3
23.5
32.6
23.9
28.4
Reform 2
-
-
-
-
-
-
-
-
-
-
-
-
-
-
-
-
-
-
-
-
-
-
-
-
-
-
-
0.4
18.4
Green Party
-
-
-
-
-
-
-
-
-
-
-
-
-
-
-
-
-
-
-
*
*
*
*
*
1.9
4.9
2.8
6.4
13.3
Liberal Democrat 3 #
24.5
11.9
28.5
25.2
33.1
8.0
4.9
22.1
18.0
7.0
3.8
10.5
16.0
9.9
8.0
23.7
19.4
14.4
25.3
23.6
20.4
17.6
16.0
20.6
24.1
5.6
4.5
8.3
8.3
Coalition Liberal
14.4
16.7
-
-
-
-
-
-
-
-
-
-
-
-
-
-
-
-
-
-
-
-
-
-
-
-
-
-
-
UKIP
-
-
-
-
-
-
-
-
-
-
-
-
-
-
-
-
-
-
-
-
-
*
*
*
5.3
15.3
2.3
*
*
Other
-
-
-
-
-
-
-
-
0.1
-
-
-
0.1
0.3
0.8
0.5
-
0.5
0.1
0.6
1.1
4.6
3.6
6.0
1.2
0.1
0.5
0.9
0.9
1 Includes National Liberal Party from 1931 - 1966
2 As the Brexit Party in 2019
3 1918-1979 - Liberal ; 1983 & 1987 - SDP-Liberal Alliance
* Included in Other
Seats
Election year
1950
1951
1955
1959
1964
1966
1970
1974
(Feb)
1974
(Oct)
1979
1983
1987
1992
1997
2001
2005
2010
2015
2017
2019
2024
Labour
2
2
2
1
1
1
0
0
1
1
1
0
1
2
2
2
0
0
1
0
4
Conservative 1
2
3
3
4
4
4
5
5
4
4
5
6
5
5
5
5
7
7
6
7
3
Greens
0
0
0
0
0
0
0
0
0
0
0
0
0
0
0
0
0
0
0
0
1[ a]
Liberal Democrat 2
1
0
0
0
0
0
0
0
0
0
0
0
0
0
0
0
0
0
0
0
0
Total
5
5
5
5
5
5
5
5
5
5
6
6
6
7
7
7
7
7
7
7
8[ a]
1 Includes National Liberal Party up to 1966
2 1950-1979 - Liberal ; 1983 & 1987 - SDP-Liberal Alliance
^ a b Includes the constituency of Waveney Valley , which also lies partly in Norfolk.
Maps
1885-1910
1885
1886
1892
1895
1900
1906
Jan 1910
Dec 1910
1918-1945
1918
1922
1923
1924
1929
1931
1935
1945
1950-1979
1950
1951
1955
1959
1964
1966
1970
1974 Feb
1974 Oct
1979
1983-present
1983
1987
1992
1997
2001
2005
2010
2015
2017
2019
2024
Timeline
Historical representation by party
A cell marked → (with a different colour background to the preceding cell) indicates that the previous MP continued to sit under a new party name.
1885 to 1918
Conservative Liberal Liberal Unionist
1918 to 1950
Coalition Liberal (1918-22) Conservative Independent Independent Liberal Labour Liberal National Liberal (1931-68)
1950 to 1983
Conservative Labour Liberal
1983 to present
Conservative Green Independent Labour
1 parts also in Norfolk
See also
Notes
^ Waveney Valley CC is a cross-county constituency between Suffolk and Norfolk, covering areas of East and Mid Suffolk, as well as electoral wards of South Norfolk .^ BC denotes borough constituency, CC denotes county constituency.
^ The majority is the number of votes the winning candidate receives more than their nearest rival.
References
UK regions and nations English counties Historic counties History of constituency boundaries in By years


