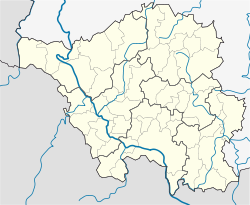
This article is about the village in Saarland. For French commune in the Sarthe department, see
Bérus.
Ortsteil of Überherrn in Saarland, Germany
Berus is a village in the municipality of Überherrn in the district of Saarlouis, Saarland, southwestern Germany. Until December 1973, Berus was a municipality of its own.
Geography and climate
The old centre of the village is situated on a spur of the Saargau overlooking the Saar valley, on the very border to Lorraine (France). The highest position is on 377 m absolute altitude. (Sauberg/French broadcast station Europe 1)
Berus has an oceanic climate (Köppen Cfb). The average annual temperature in Berus is 9.9 °C (49.8 °F). The average annual rainfall is 828.3 mm (32.61 in) with December as the wettest month. The temperatures are highest on average in July, at around 18.9 °C (66.0 °F), and lowest in January, at around 1.5 °C (34.7 °F). The highest temperature ever recorded in Berus was 37.8 °C (100.0 °F) on 25 July 2019; the coldest temperature ever recorded was −20.7 °C (−5.3 °F) on 2 February 1956.
| Climate data for Berus (1991–2020 normals, extremes 1951–present)
|
| Month
|
Jan
|
Feb
|
Mar
|
Apr
|
May
|
Jun
|
Jul
|
Aug
|
Sep
|
Oct
|
Nov
|
Dec
|
Year
|
| Record high °C (°F)
|
15.0
(59.0)
|
20.3
(68.5)
|
24.6
(76.3)
|
26.8
(80.2)
|
30.8
(87.4)
|
35.5
(95.9)
|
38.2
(100.8)
|
37.8
(100.0)
|
32.4
(90.3)
|
25.9
(78.6)
|
21.6
(70.9)
|
16.6
(61.9)
|
38.2
(100.8)
|
| Mean daily maximum °C (°F)
|
3.9
(39.0)
|
5.5
(41.9)
|
10.1
(50.2)
|
14.8
(58.6)
|
18.5
(65.3)
|
21.5
(70.7)
|
24.4
(75.9)
|
23.9
(75.0)
|
19.2
(66.6)
|
13.7
(56.7)
|
8.0
(46.4)
|
4.3
(39.7)
|
13.9
(57.0)
|
| Daily mean °C (°F)
|
1.5
(34.7)
|
2.3
(36.1)
|
5.9
(42.6)
|
9.7
(49.5)
|
13.4
(56.1)
|
16.5
(61.7)
|
18.9
(66.0)
|
18.5
(65.3)
|
14.3
(57.7)
|
9.9
(49.8)
|
5.3
(41.5)
|
2.2
(36.0)
|
9.9
(49.8)
|
| Mean daily minimum °C (°F)
|
−0.5
(31.1)
|
−0.4
(31.3)
|
2.3
(36.1)
|
5.3
(41.5)
|
8.9
(48.0)
|
12.0
(53.6)
|
14.2
(57.6)
|
14.0
(57.2)
|
10.4
(50.7)
|
6.8
(44.2)
|
3.1
(37.6)
|
0.1
(32.2)
|
6.3
(43.3)
|
| Record low °C (°F)
|
−17.4
(0.7)
|
−20.7
(−5.3)
|
−12.6
(9.3)
|
−6.3
(20.7)
|
−3.2
(26.2)
|
1.6
(34.9)
|
4.6
(40.3)
|
5.0
(41.0)
|
1.7
(35.1)
|
−4.7
(23.5)
|
−10.6
(12.9)
|
−16.1
(3.0)
|
−20.7
(−5.3)
|
| Average precipitation mm (inches)
|
79.7
(3.14)
|
64.6
(2.54)
|
57.6
(2.27)
|
44.6
(1.76)
|
68.7
(2.70)
|
67.3
(2.65)
|
64.3
(2.53)
|
65.6
(2.58)
|
63.3
(2.49)
|
73.5
(2.89)
|
73.6
(2.90)
|
94.6
(3.72)
|
828.3
(32.61)
|
| Average precipitation days (≥ 0.1 mm)
|
18.5
|
16.3
|
15.2
|
13.5
|
14.3
|
14.2
|
13.1
|
14.3
|
12.6
|
16.6
|
17.5
|
19.1
|
182.5
|
| Average relative humidity (%)
|
89.0
|
83.8
|
75.4
|
69.4
|
71.9
|
71.2
|
68.4
|
71.0
|
76.8
|
86.3
|
90.8
|
91.2
|
77.9
|
| Mean monthly sunshine hours
|
52.2
|
81.7
|
138.9
|
190.0
|
212.3
|
220.5
|
241.6
|
218.1
|
168.2
|
102.4
|
51.4
|
45.3
|
1,730.9
|
| Source 1: NOAA[1]
|
| Source 2: DWD (extremes)[2]
|
References


