2011 UK local government election
2011 Warwick District Council election|
|
|
|
|
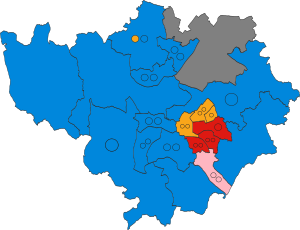
 Winner of each seat at the 2011 Warwick District Council election |
 Composition of the council after the election |
|
Elections to Warwick District Council took place on Thursday 5 May 2011.
A total of 46 seats were up for election, all councillors from all wards. The previous elections produced a majority for the Conservative Party.
Summary
Election result
| Warwick District Council Election, 2011
|
| Party
|
Candidates
|
Seats
|
Gains
|
Losses
|
Net gain/loss
|
Seats %
|
Votes %
|
Votes
|
+/−
|
|
|
Conservative
|
45
|
25
|
1
|
0
|
 1 1
|
54.3%
|
39.5%
|
45,940
|
-1.8%
|
|
|
Liberal Democrats
|
35
|
9
|
0
|
0
|

|
19.6%
|
18.3%
|
21,246
|
-5.1%
|
|
|
Labour
|
39
|
8
|
0
|
1
|
 1 1
|
17.4%
|
25.4%
|
29,478
|
+4.5%
|
|
|
Whitnash Residents
|
3
|
3
|
0
|
0
|

|
6.5%
|
4.3%
|
5,002
|
-0.8%
|
|
|
Green
|
46
|
0
|
0
|
0
|

|
0.0%
|
11.5%
|
13,345
|
+3.3%
|
|
|
UKIP
|
3
|
0
|
0
|
0
|

|
0.0%
|
0.4%
|
485
|
N/A
|
|
|
Independent
|
2
|
1
|
0
|
0
|

|
2.2%
|
0.6%%
|
750
|
±0.0%
|
Ward results
[1]
Bishop's Tachbrook
Budbrooke
Cubbington
Kenilworth Abbey
Kenilworth Park Hill
Kenilworth St. John's
Lapworth
Leamington Brunswick
Leamington Clarendon
Leamington Crown
Leamington Manor
Leamington Milverton
Leamington Willes
Leek Wootton
Radford Semele
Stoneleigh
Warwick North
Warwick South
Warwick West
Whitnash
References

