1976 United States presidential election in Mississippi
1976 United States presidential election in Mississippi
County Results
Carter
40-50%
50-60%
60-70%
70-80%
Ford
40-50%
50-60%
60-70%
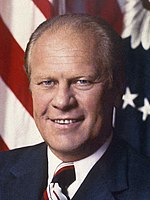
Gerald Ford campaigning in Gulfport, Mississippi The 1976 United States presidential election in Mississippi was held on November 2, 1976. The Democratic Party candidate Jimmy Carter won the state of Mississippi. He narrowly won the state with 49.56% of the vote, and all seven of the state's electors were pledged to Carter.[ 1]
In the 1972 election, Mississippi had Richard Nixon 's strongest showing in the country, giving him 78% of the vote. Carter managed to carry Mississippi in 1976 by a slim margin of 1.88% against incumbent Republican President Gerald Ford . At that time, Carter’s performance in Mississippi was the narrowest victory for a post-Reconstruction Democratic presidential candidate, as he failed to win a majority of the vote. This was also the first time since 1848 that the state was decided by a single-digit margin.
While Carter performed well in northern Mississippi and in Black majority counties along the Mississippi River , President Ford’s wins in Hinds County (Jackson ) and neighboring Rankin County , both of which were won with over sixty percent of the vote, along with a substantial win in Harrison County (Biloxi and Gulfport ), kept the race in Mississippi extremely close.
As of the 2024 presidential election [update] Hancock County , Neshoba County , DeSoto County , Carroll County , Covington County , Pearl River County , George County , Wayne County , Stone County , Greene County , Perry County , and Webster County .[ 2]
60% of white voters supported Ford while 36% supported Carter.
Predictions
Results
Results by county
County[ 10]
Jimmy Carter
Gerald Ford
Thomas Anderson
Lester Maddox
Eugene McCarthy
Peter Camejo
Roger MacBride
Margin
Total votes cast
#
%
#
%
#
%
#
%
#
%
#
%
#
%
#
%
Adams
6,619
47.75%
6,431
46.40%
80
0.58%
153
1.10%
56
0.40%
227
1.64%
295
2.13%
188
1.35%
13,861
Alcorn
6,995
64.95%
3,430
31.85%
96
0.89%
121
1.12%
59
0.55%
36
0.33%
33
0.31%
3,565
33.10%
10,770
Amite
2,574
51.49%
2,256
45.13%
61
1.22%
45
0.90%
20
0.40%
24
0.48%
19
0.38%
318
6.36%
4,999
Attala
4,068
54.80%
3,146
42.38%
64
0.86%
64
0.86%
35
0.47%
23
0.31%
23
0.31%
922
12.42%
7,423
Benton
2,375
74.01%
790
24.62%
25
0.78%
19
0.59%
0
0.00%
0
0.00%
0
0.00%
1,585
49.39%
3,209
Bolivar
7,561
58.73%
5,136
39.89%
102
0.79%
20
0.16%
31
0.24%
12
0.09%
13
0.10%
2,425
18.84%
12,875
Calhoun
2,724
56.89%
1,892
39.52%
70
1.46%
34
0.71%
24
0.50%
26
0.54%
18
0.38%
832
17.37%
4,788
Carroll
1,566
49.45%
1,561
49.29%
15
0.47%
13
0.41%
5
0.16%
3
0.09%
4
0.13%
5
0.16%
3,167
Chickasaw
2,891
50.52%
2,581
45.10%
66
1.15%
54
0.94%
47
0.82%
45
0.79%
39
0.68%
310
5.42%
5,723
Choctaw
1,520
47.93%
1,561
49.23%
36
1.14%
18
0.57%
17
0.54%
7
0.22%
12
0.38%
-41
-1.30%
3,171
Claiborne
2,657
68.98%
1,078
27.99%
36
0.93%
11
0.29%
23
0.60%
13
0.34%
34
0.88%
1,579
40.99%
3,852
Clarke
2,816
46.97%
2,935
48.96%
45
0.75%
66
1.10%
51
0.85%
41
0.68%
41
0.68%
-119
-1.99%
5,995
Clay
3,514
51.40%
3,017
44.13%
64
0.94%
79
1.16%
61
0.89%
55
0.80%
47
0.69%
497
7.27%
6,837
Coahoma
6,412
57.70%
4,269
38.41%
104
0.94%
109
0.98%
106
0.95%
63
0.57%
50
0.45%
2,143
19.29%
11,113
Copiah
4,267
49.35%
4,108
47.51%
68
0.79%
64
0.74%
43
0.50%
51
0.59%
45
0.52%
159
1.84%
8,646
Covington
2,862
51.40%
2,591
46.53%
33
0.59%
21
0.38%
23
0.41%
19
0.34%
19
0.34%
271
4.87%
5,568
DeSoto
7,756
54.19%
6,240
43.60%
78
0.54%
69
0.48%
88
0.61%
46
0.32%
35
0.24%
1,516
10.59%
14,312
Forrest
7,914
41.39%
10,770
56.33%
167
0.87%
93
0.49%
95
0.50%
42
0.22%
39
0.20%
-2,856
-14.94%
19,120
Franklin
1,578
46.48%
1,719
50.63%
29
0.85%
31
0.91%
17
0.50%
12
0.35%
9
0.27%
-141
-4.15%
3,395
George
3,072
58.75%
1,957
37.43%
56
1.07%
39
0.75%
44
0.84%
34
0.65%
27
0.52%
1,115
21.32%
5,229
Greene
2,127
56.42%
1,538
40.80%
16
0.42%
34
0.90%
17
0.45%
15
0.40%
23
0.61%
589
15.62%
3,770
Grenada
3,263
46.48%
3,569
50.84%
72
1.03%
25
0.36%
45
0.64%
29
0.41%
17
0.24%
-306
-4.36%
7,020
Hancock
3,855
49.16%
3,765
48.01%
47
0.60%
68
0.87%
44
0.56%
35
0.45%
28
0.36%
90
1.15%
7,842
Harrison
16,569
44.61%
19,207
51.72%
361
0.97%
328
0.88%
301
0.81%
207
0.56%
166
0.45%
-2,638
-7.11%
37,139
Hinds
28,748
37.95%
45,803
60.46%
415
0.55%
261
0.34%
270
0.36%
114
0.15%
145
0.19%
-17,055
-22.51%
75,756
Holmes
4,616
64.08%
2,438
33.85%
54
0.75%
37
0.51%
23
0.32%
15
0.21%
20
0.28%
2,178
30.23%
7,203
Humphreys
2,172
57.55%
1,445
38.29%
39
1.03%
37
0.98%
40
1.06%
20
0.53%
21
0.56%
727
19.26%
3,774
Issaquena
567
59.43%
325
34.07%
19
1.99%
17
1.78%
16
1.68%
8
0.84%
2
0.21%
242
25.36%
954
Itawamba
4,480
66.82%
2,153
32.11%
25
0.37%
10
0.15%
23
0.34%
6
0.09%
8
0.12%
2,327
34.71%
6,705
Jackson
12,533
40.32%
17,177
55.26%
332
1.07%
394
1.27%
248
0.80%
201
0.65%
197
0.63%
-4,644
-14.94%
31,082
Jasper
3,109
56.39%
2,356
42.74%
28
0.51%
12
0.22%
4
0.07%
2
0.04%
2
0.04%
753
13.65%
5,513
Jefferson
2,562
74.78%
782
22.83%
21
0.61%
18
0.53%
19
0.55%
11
0.32%
13
0.38%
1,780
51.95%
3,426
Jefferson Davis
2,747
58.47%
1,868
39.76%
25
0.53%
13
0.28%
13
0.28%
15
0.32%
17
0.36%
879
18.71%
4,698
Jones
10,139
47.04%
11,098
51.49%
102
0.47%
81
0.38%
63
0.29%
28
0.13%
41
0.19%
-959
-4.45%
21,552
Kemper
2,436
58.56%
1,680
40.38%
23
0.55%
14
0.34%
4
0.10%
3
0.07%
0
0.00%
756
18.18%
4,160
Lafayette
4,375
52.39%
3,735
44.73%
57
0.68%
58
0.69%
64
0.77%
40
0.48%
22
0.26%
640
7.66%
8,351
Lamar
3,109
41.93%
4,056
54.71%
97
1.31%
89
1.20%
35
0.47%
7
0.09%
21
0.28%
-947
-12.78%
7,414
Lauderdale
9,813
40.14%
14,273
58.39%
131
0.54%
134
0.55%
45
0.18%
17
0.07%
33
0.13%
-4,460
-18.25%
24,446
Lawrence
2,242
50.54%
2,109
47.54%
33
0.74%
19
0.43%
16
0.36%
7
0.16%
10
0.23%
133
3.00%
4,436
Leake
3,415
52.47%
2,952
45.36%
39
0.60%
33
0.51%
27
0.41%
29
0.45%
13
0.20%
463
7.11%
6,508
Lee
8,504
52.07%
7,366
45.10%
229
1.40%
49
0.30%
109
0.67%
52
0.32%
24
0.15%
1,138
6.97%
16,333
Leflore
6,135
48.73%
5,872
46.64%
255
2.03%
74
0.59%
129
1.02%
85
0.68%
39
0.31%
263
2.09%
12,589
Lincoln
4,043
38.90%
6,084
58.55%
72
0.69%
85
0.82%
47
0.45%
37
0.36%
24
0.23%
-2,041
-19.65%
10,392
Lowndes
6,181
42.05%
8,003
54.44%
275
1.87%
68
0.46%
63
0.43%
55
0.37%
55
0.37%
-1,822
-12.39%
14,700
Madison
6,240
55.14%
4,838
42.75%
120
1.06%
50
0.44%
31
0.27%
9
0.08%
28
0.25%
1,402
12.39%
11,316
Marion
5,283
49.20%
5,300
49.36%
66
0.61%
28
0.26%
23
0.21%
17
0.16%
20
0.19%
-17
-0.16%
10,737
Marshall
6,769
73.37%
2,242
24.30%
49
0.53%
47
0.51%
50
0.54%
31
0.34%
38
0.41%
4,527
49.07%
9,226
Monroe
6,097
54.27%
4,737
42.17%
100
0.89%
75
0.67%
91
0.81%
68
0.61%
66
0.59%
1,360
12.10%
11,234
Montgomery
2,410
49.93%
2,278
47.19%
42
0.87%
32
0.66%
33
0.68%
17
0.35%
15
0.31%
132
2.74%
4,827
Neshoba
3,891
49.76%
3,859
49.35%
25
0.32%
23
0.29%
8
0.10%
5
0.06%
8
0.10%
32
0.41%
7,819
Newton
2,741
40.97%
3,813
57.00%
114
1.70%
8
0.12%
8
0.12%
3
0.04%
3
0.04%
-1,072
-16.03%
6,690
Noxubee
2,121
51.28%
1,860
44.97%
45
1.09%
39
0.94%
36
0.87%
26
0.63%
9
0.22%
261
6.31%
4,136
Oktibbeha
4,339
44.62%
5,194
53.41%
61
0.63%
27
0.28%
46
0.47%
20
0.21%
38
0.39%
-855
-8.79%
9,725
Panola
5,517
60.85%
3,341
36.85%
70
0.77%
35
0.39%
45
0.50%
31
0.34%
28
0.31%
2,176
24.00%
9,067
Pearl River
5,024
51.98%
4,332
44.82%
56
0.58%
105
1.09%
74
0.77%
32
0.33%
42
0.43%
692
7.16%
9,665
Perry
1,965
52.75%
1,527
40.99%
112
3.01%
39
1.05%
38
1.02%
24
0.64%
20
0.54%
438
11.76%
3,725
Pike
5,749
48.92%
5,659
48.16%
109
0.93%
103
0.88%
54
0.46%
28
0.24%
49
0.42%
90
0.76%
11,751
Pontotoc
4,066
62.64%
2,245
34.59%
77
1.19%
31
0.48%
26
0.40%
18
0.28%
28
0.43%
1,821
28.05%
6,491
Prentiss
4,431
63.51%
2,362
33.85%
44
0.63%
42
0.60%
46
0.66%
29
0.42%
23
0.33%
2,069
29.66%
6,977
Quitman
2,621
64.80%
1,287
31.82%
34
0.84%
25
0.62%
30
0.74%
23
0.57%
25
0.62%
1,334
32.98%
4,045
Rankin
6,937
36.75%
11,507
60.95%
133
0.70%
125
0.66%
83
0.44%
54
0.29%
39
0.21%
-4,570
-24.20%
18,878
Scott
3,643
48.78%
3,649
48.86%
61
0.82%
59
0.79%
25
0.33%
14
0.19%
17
0.23%
-6
-0.08%
7,468
Sharkey
1,283
52.39%
1,024
41.81%
43
1.76%
23
0.94%
33
1.35%
21
0.86%
22
0.90%
259
10.58%
2,449
Simpson
3,600
45.23%
4,291
53.91%
33
0.41%
22
0.28%
11
0.14%
1
0.01%
2
0.03%
-691
-8.68%
7,960
Smith
2,434
42.35%
3,147
54.75%
32
0.56%
53
0.92%
32
0.56%
20
0.35%
30
0.52%
-713
-12.40%
5,748
Stone
1,648
50.27%
1,575
48.05%
26
0.79%
9
0.27%
5
0.15%
1
0.03%
14
0.43%
73
2.22%
3,278
Sunflower
4,322
53.86%
3,456
43.07%
69
0.86%
46
0.57%
49
0.61%
47
0.59%
35
0.44%
866
10.79%
8,024
Tallahatchie
2,991
56.95%
2,146
40.86%
37
0.70%
29
0.55%
20
0.38%
17
0.32%
12
0.23%
845
16.09%
5,252
Tate
3,747
58.22%
2,497
38.80%
51
0.79%
57
0.89%
40
0.62%
20
0.31%
24
0.37%
1,250
19.42%
6,436
Tippah
4,260
67.90%
1,887
30.08%
47
0.75%
26
0.41%
25
0.40%
15
0.24%
14
0.22%
2,373
37.82%
6,274
Tishomingo
3,734
63.95%
1,969
33.72%
53
0.91%
28
0.48%
20
0.34%
20
0.34%
15
0.26%
1,765
30.23%
5,839
Tunica
1,695
61.50%
951
34.51%
23
0.83%
24
0.87%
33
1.20%
17
0.62%
13
0.47%
744
26.99%
2,756
Union
5,021
65.56%
2,507
32.73%
52
0.68%
38
0.50%
20
0.26%
9
0.12%
12
0.16%
2,514
32.83%
7,659
Walthall
2,650
53.79%
2,110
42.83%
50
1.01%
40
0.81%
44
0.89%
23
0.47%
10
0.20%
540
10.96%
4,927
Warren
6,299
40.11%
8,699
55.39%
231
1.47%
144
0.92%
152
0.97%
100
0.64%
80
0.51%
-2,400
-15.28%
15,705
Washington
9,650
53.17%
7,474
41.18%
346
1.91%
153
0.84%
222
1.22%
136
0.75%
168
0.93%
2,176
11.99%
18,149
Wayne
3,306
51.48%
3,022
47.06%
14
0.22%
36
0.56%
10
0.16%
13
0.20%
21
0.33%
284
4.42%
6,422
Webster
2,218
51.81%
1,943
45.39%
44
1.03%
37
0.86%
15
0.35%
11
0.26%
13
0.30%
275
6.42%
4,281
Wilkinson
2,514
65.38%
1,273
33.11%
16
0.42%
13
0.34%
11
0.29%
7
0.18%
11
0.29%
1,241
32.27%
3,845
Winston
3,956
50.77%
3,659
46.96%
60
0.77%
34
0.44%
37
0.47%
28
0.36%
18
0.23%
297
3.81%
7,792
Yalobusha
2,603
57.81%
1,808
40.15%
32
0.71%
30
0.67%
7
0.16%
14
0.31%
9
0.20%
795
17.66%
4,503
Yazoo
4,053
47.85%
4,255
50.23%
42
0.50%
45
0.53%
31
0.37%
19
0.22%
26
0.31%
-202
-2.38%
8,471
Totals
381,309
49.56%
366,846
47.68%
6,678
0.87%
4,861
0.63%
4,074
0.53%
2,805
0.36%
2,787
0.36%
14,463
1.88%
769,360
Counties that flipped from Republican to Democratic
References
^ a b "1976 Presidential General Election Results – Mississippi" . Retrieved May 18, 2016 .^ Sullivan, Robert David; ‘How the Red and Blue Map Evolved Over the Past Century’ ; America Magazine in The National Catholic Review ; June 29, 2016
^ Joyce, Faye S. (September 13, 1976). "Southerners Favour Carter, Poll Shows". The Atlanta Constitution ^ Patterson, Kathleen (October 26, 1976). "South Still Hard To Peg". Kansas City Times Kansas City , Missouri . p. 10. ^ "Convention Wounds Remain". Daily News New York City . October 27, 1976. p. 45. ^ "Political Science Majors Predict Ford Win". Sun Herald Biloxi, Mississippi . October 31, 1976. p. D-11. ^ "Electoral Votes: A Photo Finish — Polls". Austin American-Statesman ^ "MS US President Race, November 02, 1976" . Our Campaigns.
Works cited


