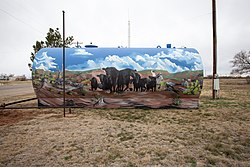
Unincorporated community in Texas, United States
Truscott is an unincorporated community in Knox County , Texas , United States. According to the Handbook of Texas , the community had an estimated population of 50.[ 2]
It is located at 33°45′15″N 99°48′40″W / 33.75417°N 99.81111°W / 33.75417; -99.81111 FM 1756 in north central Knox County, approximately 100 miles north of Abilene .[ 3]
The community was settled in the 1880s and was named after J.J. Truscott, a local pioneer. The population peaked at around 500 in 1940 and declined thereafter.[ 2]
Public education in the community of Truscott is provided by the Crowell Independent School District .
Climate
According to the Köppen Climate Classification system, Truscott has a humid subtropical climate , abbreviated "Cfa" on climate maps. The hottest temperature recorded in Truscott was 118 °F (47.8 °C) on June 28, 1994 and June 20, 2011, while the coldest temperature recorded was −10 °F (−23.3 °C) on December 22–23, 1989.[ 4]
Climate data for Truscott, Texas, 1991–2020 normals, extremes 1963–present
Month
Jan
Feb
Mar
Apr
May
Jun
Jul
Aug
Sep
Oct
Nov
Dec
Year
Record high °F (°C)
89
96
102
107
113
118
114
114
111
106
91
87
118
Mean maximum °F (°C)
77.5
82.3
88.7
94.8
99.9
103.6
106.6
105.4
100.5
94.6
83.9
77.8
108.6
Mean daily maximum °F (°C)
55.2
59.5
67.7
77.2
85.2
92.9
97.2
96.9
88.0
78.1
65.9
56.4
76.7
Daily mean °F (°C)
42.4
46.0
53.9
62.8
72.1
80.7
84.7
83.9
75.7
64.6
52.9
43.7
63.6
Mean daily minimum °F (°C)
29.5
32.6
40.1
48.4
59.1
68.5
72.2
71.0
63.4
51.1
40.0
31.0
50.6
Mean minimum °F (°C)
17.2
19.4
24.8
34.5
44.5
58.1
64.2
62.5
50.2
35.1
24.4
19.3
13.3
Record low °F (°C)
−2
−6
6
21
36
37
54
51
38
19
14
−10
−10
Average precipitation inches (mm)
1.09
1.45
1.71
2.18
3.48
3.43
2.07
2.05
2.89
2.41
1.54
1.13
25.43
Average snowfall inches (cm)
0.9
0.0
0.0
0.0
0.0
0.0
0.0
0.0
0.0
0.0
0.3
0.0
1.2
Average precipitation days (≥ 0.01 in)
3.6
3.8
5.1
4.8
6.9
6.0
4.9
4.6
5.7
5.0
3.5
3.4
57.3
Average snowy days (≥ 0.1 in)
0.4
0.1
0.0
0.0
0.0
0.0
0.0
0.0
0.0
0.0
0.1
0.1
0.7
Source 1: NOAA[ 5]
Source 2: National Weather Service[ 4]
References
External links


