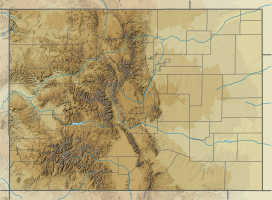
Mountain in the U.S. state of Colorado
South River Peak , elevation 13,154 ft (4,009 m), is a summit in the San Juan Mountains of southwestern Colorado , United States. The mountain is in the Weminuche Wilderness of Rio Grande National Forest .
Climate
South River Peak has an Alpine climate (Köppen ET ). There is no weather station at the summit of South River Peak, but this climate table contains interpolated data for an area around the summit.
Climate data for South River Peak 37.5683 N, 106.9760 W, Elevation: 12,644 ft (3,854 m) (1991–2020 normals)
Month
Jan
Feb
Mar
Apr
May
Jun
Jul
Aug
Sep
Oct
Nov
Dec
Year
Mean daily maximum °F (°C)
26.2
26.2
31.5
36.8
45.0
55.7
60.6
58.1
52.2
42.4
32.9
26.0
41.1
Daily mean °F (°C)
15.1
14.8
19.7
24.8
33.3
43.5
48.5
46.8
41.1
31.6
22.2
15.2
29.7
Mean daily minimum °F (°C)
3.9
3.4
7.8
12.7
21.5
31.2
36.4
35.5
30.0
20.8
11.5
4.4
18.3
Average precipitation inches (mm)
5.96
6.74
6.42
4.91
3.67
1.42
3.44
4.80
5.04
5.92
5.99
6.44
60.75
Source: PRISM Climate Group[ 5]
Middle Creek SNOTEL is a weather station on the northern flank of South River Peak, in the Red Mountain Creek Valley. Middle Creek has a subarctic climate (Köppen Dfc ).
Climate data for Middle Creek, Colorado, 1991–2020 normals, 1983-2020 extremes: 11250ft (3429m)
Month
Jan
Feb
Mar
Apr
May
Jun
Jul
Aug
Sep
Oct
Nov
Dec
Year
Record high °F (°C)
64
62
70
69
77
78
81
87
83
82
69
65
87
Mean maximum °F (°C)
50
50
54
57
62
71
73
70
67
61
54
49
74
Mean daily maximum °F (°C)
32.4
33.2
39.5
43.6
50.8
60.5
65.3
62.6
56.4
47.4
38.1
31.8
46.8
Daily mean °F (°C)
18.6
19.4
25.3
30.4
39.0
47.6
52.3
50.4
44.7
35.4
25.3
18.7
33.9
Mean daily minimum °F (°C)
4.9
5.7
11.1
17.1
26.9
35.0
39.3
38.2
32.9
23.5
12.6
5.7
21.1
Mean minimum °F (°C)
−14
−13
−8
0
12
24
33
32
21
6
−10
−16
−19
Record low °F (°C)
−26
−26
−17
−10
1
12
22
16
9
−10
−19
−34
−34
Average precipitation inches (mm)
3.04
3.66
3.52
3.29
2.02
1.16
2.72
3.59
3.35
3.77
3.58
3.37
37.07
Source 1: XMACIS2[ 6]
Source 2: NOAA (Precipitation)[ 7]
Historical names
Macomb Peak
South River Peak – 1906 [ 1]
See also
References
^ a b "South River Peak" . Geographic Names Information System United States Geological Survey , United States Department of the Interior . Retrieved November 13, 2014 .^ a b c "S RIVER" . NGS Data Sheet . National Geodetic Survey , National Oceanic and Atmospheric Administration , United States Department of Commerce . Retrieved October 22, 2014 .^ The elevation of South River Peak includes an adjustment of +1.879 m (+6.16 ft) from NGVD 29 to NAVD 88 .
^ a b c "South River Peak, Colorado" . Peakbagger.com . Retrieved October 22, 2014 .^ "PRISM Climate Group, Oregon State University" . PRISM Climate Group, Oregon State University. Retrieved November 1, 2023 . To find the table data on the PRISM website, start by clicking Coordinates (under Location ); copy Latitude and Longitude figures from top of table; click Zoom to location ; click Precipitation, Minimum temp, Mean temp, Maximum temp ; click 30-year normals, 1991-2020 ; click 800m ; click Retrieve Time Series button. ^
"xmACIS2" . National Oceanic and Atmospheric Administration. Retrieved November 1, 2023 .
^
"Middle Creek, Colorado 1991-2020 Monthly Normals" . Retrieved November 1, 2023 .
External links
