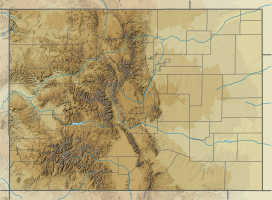
Mountain pass in Colorado, US
Ripple Creek Pass is a high mountain pass in The Flat Tops mountains of western Colorado. Rio Blanco County Road 8, a gravel road, traverses the pass, which divides the watersheds of Poose Creek to the north and Snell Creek to the south.[2] The border between Routt and White River national forests also crosses the pass.
The pass, part of the Flat Tops Trail Scenic and Historic Byway, is accessible to passenger cars, but only seasonally, generally from late May to October. The Ripple Creek Overlook, south of the actual pass, provides views of The Flat Tops and the Flat Tops Wilderness Area.[3]
Climate
| Climate data for Ripple Creek Pass, Colorado, 1991–2020 normals, 1986-2020 extremes: 10340ft (3152m)
|
| Month
|
Jan
|
Feb
|
Mar
|
Apr
|
May
|
Jun
|
Jul
|
Aug
|
Sep
|
Oct
|
Nov
|
Dec
|
Year
|
| Record high °F (°C)
|
53
(12)
|
63
(17)
|
73
(23)
|
76
(24)
|
77
(25)
|
87
(31)
|
89
(32)
|
85
(29)
|
87
(31)
|
75
(24)
|
64
(18)
|
57
(14)
|
89
(32)
|
| Mean maximum °F (°C)
|
43.4
(6.3)
|
45.2
(7.3)
|
53.6
(12.0)
|
59.5
(15.3)
|
65.6
(18.7)
|
72.8
(22.7)
|
77.2
(25.1)
|
74.8
(23.8)
|
70.9
(21.6)
|
61.8
(16.6)
|
50.7
(10.4)
|
41.5
(5.3)
|
77.7
(25.4)
|
| Mean daily maximum °F (°C)
|
27.6
(−2.4)
|
30.6
(−0.8)
|
38.9
(3.8)
|
44.3
(6.8)
|
52.4
(11.3)
|
62.5
(16.9)
|
69.1
(20.6)
|
66.7
(19.3)
|
59.1
(15.1)
|
46.6
(8.1)
|
34.3
(1.3)
|
26.0
(−3.3)
|
46.5
(8.1)
|
| Daily mean °F (°C)
|
18.3
(−7.6)
|
20.0
(−6.7)
|
27.0
(−2.8)
|
32.3
(0.2)
|
40.7
(4.8)
|
50.3
(10.2)
|
57.2
(14.0)
|
55.2
(12.9)
|
48.0
(8.9)
|
36.5
(2.5)
|
25.2
(−3.8)
|
17.5
(−8.1)
|
35.7
(2.0)
|
| Mean daily minimum °F (°C)
|
9.0
(−12.8)
|
9.5
(−12.5)
|
14.9
(−9.5)
|
20.3
(−6.5)
|
29.0
(−1.7)
|
38.0
(3.3)
|
45.2
(7.3)
|
43.7
(6.5)
|
36.8
(2.7)
|
26.4
(−3.1)
|
16.1
(−8.8)
|
9.0
(−12.8)
|
24.8
(−4.0)
|
| Mean minimum °F (°C)
|
−8.7
(−22.6)
|
−8.3
(−22.4)
|
−1.7
(−18.7)
|
4.4
(−15.3)
|
15.5
(−9.2)
|
26.9
(−2.8)
|
36.8
(2.7)
|
36.0
(2.2)
|
23.0
(−5.0)
|
8.9
(−12.8)
|
−4.1
(−20.1)
|
−10.2
(−23.4)
|
−14.3
(−25.7)
|
| Record low °F (°C)
|
−19
(−28)
|
−27
(−33)
|
−15
(−26)
|
−7
(−22)
|
3
(−16)
|
16
(−9)
|
26
(−3)
|
29
(−2)
|
5
(−15)
|
−5
(−21)
|
−16
(−27)
|
−30
(−34)
|
−30
(−34)
|
| Average precipitation inches (mm)
|
4.96
(126)
|
4.45
(113)
|
4.14
(105)
|
5.01
(127)
|
3.20
(81)
|
1.54
(39)
|
1.23
(31)
|
1.17
(30)
|
2.21
(56)
|
2.81
(71)
|
3.86
(98)
|
4.43
(113)
|
39.01
(990)
|
| Average extreme snow depth inches (cm)
|
67.8
(172)
|
81.4
(207)
|
87.5
(222)
|
86.3
(219)
|
71.4
(181)
|
28.4
(72)
|
1.4
(3.6)
|
0.0
(0.0)
|
2.3
(5.8)
|
11.9
(30)
|
31.6
(80)
|
51.4
(131)
|
91.4
(232)
|
| Average precipitation days (≥ 0.01 in)
|
17.2
|
16.3
|
17.2
|
17.1
|
13.6
|
7.7
|
6.5
|
6.9
|
9.1
|
11.0
|
13.6
|
16.5
|
152.7
|
| Source 1: XMACIS2(normals, records & 2002-2020 snow depth)[4]
|
| Source 2: NOAA (precip/precip days)[5]
|
References

