Results of the 2021 Western Australian state election (Legislative Council)

2021 Western Australian state election (Legislative Council)

← 2017 13 March 2021 2025 →

All 36 seats on the Legislative Council
18 seats needed for a majority
  First party Second party Third party
 
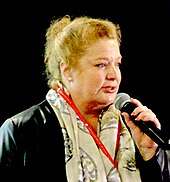
Sue Ellery.jpg
Leader Sue Ellery Steve Thomas Colin de Grussa
Party Labor Liberal National
Leader's seat South Metropolitan South West Agricultural
Seats before 14 9 4
Seats won 22 7 3
Seat change Increase 8 Decrease 2 Decrease 1
Popular vote 868,374 254,380 40,285
Percentage 60.34% 17.68% 2.80%
Swing Increase 19.93pp Decrease 9.03pp Decrease 1.63pp

  Fourth party Fifth party Sixth party
 
LCWA
Leader No leader No leader Wilson Tucker
Party Legalise Cannabis Greens Daylight Saving
Alliance MPA
Leader's seat South Metropolitan Mining and Pastoral
Seats before 0 4 0
Seats won 2 1 1
Seat change Increase 2 Decrease 3 Increase 1
Popular vote 28,473 91,849 3,485
Percentage 1.98% 6.38% 0.24%
Swing Increase 1.98pp Decrease 2.22pp Decrease 0.44pp

  Seventh party Eighth party Ninth party
 
PHON
SFF
Leader Colin Tincknell Rick Mazza Aaron Stonehouse
Party One Nation SFF Liberal Democrats
Leader's seat South West
(lost seat)
Agricultural
(lost seat)
South Metropolitan
(lost seat)
Seats before 3 1 1
Seats won 0 0 0
Seat change Decrease 3 Decrease 1 Decrease 1
Popular vote 21,259 21,210 9,218
Percentage 1.48% 1.47% 0.64%
Swing Decrease 6.71pp Decrease 0.89pp Decrease 1.13pp

This is a list of electoral region results for the Western Australian Legislative Council in the 2021 Western Australian state election.

Results summary
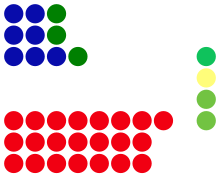
Government (22)
  Labor (22)
Opposition (10)
  Liberal (7)
  National (3)
Crossbench (4)
  Legalise Cannabis (2)
  Greens (1)
  Daylight Saving (1)
Legislative Council (STV/GVT) – Turnout 85.50% (CV)[1]
Party Primary votes % Swing Seats +/-
  Labor 868,374 60.34 +19.93 22 Increase 8
  Liberal 254,380 17.68 −9.03 7 Decrease 2
  Greens 91,849 6.38 −2.22 1 Decrease 3
  National 40,285 2.80 −1.63 3 Decrease 1
  Legalise Cannabis 28,473 1.98 +1.98 2 Increase 2
  Australian Christians 28,051 1.95 +0.01 0 Steady
  One Nation 21,259 1.48 −6.71 0 Decrease 3
  Shooters, Fishers, Farmers 21,210 1.47 −0.89 0 Decrease 1
  No Mandatory Vaccination 16,094 1.12 +1.12 0 Steady
  Western Australia Party 10,496 0.73 +0.34 0 Steady
  Animal Justice 9,732 0.64 −0.42 0 Steady
  Liberal Democrats 9,218 0.64 −1.13 0 Decrease 1
  Liberals for Climate 7,515 0.52 +0.08 0 Steady
  WAxit 4,924 0.34 −0.21 0 Steady
  Sustainable Australia 4,405 0.31 +0.31 0 Steady
  Daylight Saving 3,485 0.24 −0.44 1 Increase 1
  Great Australian 3,397 0.24 +0.24 0 Steady
  Health Australia 3,105 0.22 +0.22 0 Steady
  Socialist Alliance 948 0.07 −0.04 0 Steady
  Independents 11,486 0.80 −0.35 0 Steady
  Other 482 0.03 +0.03 0 Steady
 Formal votes 1,439,168 98.05 +0.76
 Informal votes 28,577 1.95 −0.76
 Total 1,467,745 36
 Registered voters / turnout 1,716,732 85.50

Distribution of seats

Results by electoral region

Agricultural

2021 Western Australian state election: Agricultural[2]
Party Candidate Votes % ±%
Quota 12,357
Labor 1. Darren West (elected 1)
2. Shelley Payne (elected 3)
3. Sandra Carr (elected 4)
4. Luke Clarkson
39,263 45.39 +21.39
National 1. Colin de Grussa (elected 2)
2. Martin Aldridge (elected 6)
3. Natasha Colliver
4. Steve Blyth
5. Rob Horstman
6. Ian Hanna
22,999 26.59 −4.72
Liberal 1. Steve Martin (elected 5)
2. Kathryn Jackson
3. Jim Chown
4. Maria Girak
5. Brett Jackson
10,672 12.34 −6.31
Shooters, Fishers, Farmers 1. Stuart Ostle
2. Ronald Lean
3,572 4.13 −1.52
Greens 1. Peter Leam
2. Vivienne Glance
2,579 2.98 −0.62
One Nation 1. Rod Caddies
2. Emma McKinley
1,765 2.04 −9.62
Christians 1. Trevor Young
2. Les Holten
1,295 1.50 −0.34
Legalise Cannabis 1. Leo Treasure
2. Keith Clinton
1,150 1.33 +1.33
No Mandatory Vaccination 1. Aaron Horsman
2. Jessica Young
685 0.79 +0.79
Western Australia 1. Michael O'Loghlen
2. Allan Butson
462 0.53 +0.24
Animal Justice 1. Courtney Henry
2. Roberta Vlaar
339 0.39 +0.39
Liberal Democrats 1. Connor Whittle
2. Cameron Puttick
339 0.39 −0.70
Liberals for Climate 1. Peter Turner
2. Nathan Thomson
205 0.24 −0.12
Health Australia 1. Bass Tadros
2. Svetlana Ivanchenko
201 0.23 +0.23
WAxit 1. Russell Sewell
2. Simon Glossop
186 0.22 +0.11
Great Australian 1. Lawrie Carr
2. Shane Edwards
185 0.21 +0.21
Sustainable Australia 1. Greg Norris
2. James Fowler
153 0.18 +0.18
Independent Parminder Singh 134 0.15 +0.15
Daylight Saving 1. Brett Tucker
2. Andrew Wilson
69 0.08 −0.14
Independent 1. J. M. David 66 0.08 +0.08
Independent 1. Felly Chandra
2. Chelsea Henderson
62 0.07 +0.07
Independent Andrew Ballantyne 36 0.04 +0.04
Independent Les Mirco 27 0.03 +0.03
Independent Peter Wallis 25 0.03 +0.03
Independent Steven Hopkins 24 0.03 +0.03
Total formal votes 86,493 97.77 +0.68
Informal votes 1,969 2.23 −0.68
Turnout 88,462 85.57 −1.63

East Metropolitan

2021 Western Australian state election: East Metropolitan[3]
Party Candidate Votes % ±%
Quota 50,311
Labor 1. Alanna Clohesy (elected 1)
2. Samantha Rowe (elected 2)
3. Matthew Swinbourn (elected 3)
4. Lorna Harper (elected 4)
5. Robert Green
6. John Keogh
232,094 65.90 +19.40
Liberal 1. Donna Faragher (elected 5)
2. Phil Twiss
3. Greg Halls
4. Daniel Newman
5. Jeremy Quinn
48,343 13.73 −11.23
Greens 1. Tim Clifford
2. Caroline Perks
3. Callan Gray
21,285 6.04 −2.86
Legalise Cannabis 1. Brian Walker (elected 6)
2. Karl Reinmuth
9,258 2.63 +2.63
Christians 1. Maryka Groenewald
2. Jamie van Burgel
8,860 2.52 +0.04
One Nation 1. Dale Grillo
2. Tim Orr
5,122 1.45 −6.57
Shooters, Fishers, Farmers 1. Trevor Ruwoldt
2. Coby Thomas
4,436 1.26 −0.78
No Mandatory Vaccination 1. Patricia Ayre
2. Daniel Hall
3,987 1.13 +1.13
Western Australia 1. Charles Smith
2. James Anthony
2,904 0.82 +0.41
Independent Peter Lyndon-James 2,738 0.78 +0.78
Animal Justice 1. Amanda Dorn
2. Nicole Arielli
2,571 0.73 −0.73
Liberal Democrats 1. Craig Buchanan
2. Neil Hamilton
1,879 0.53 −0.50
Liberals for Climate 1. Marilyn Lottering
2. R. Smith
1,818 0.52 +0.06
Independent 1. David Larsen
2. Brian Brightman
1,360 0.39 +0.39
WAxit 1. Satinder Samra
2. Robin Singh
3. Monty Singh
1,223 0.35 −0.41
Health Australia 1. Lidia Skorokhod
2. Lisa Rowe
1,106 0.31 +0.31
Sustainable Australia 1. Nicole Watts
2. Keith Lethbridge
1,047 0.30 +0.30
Daylight Saving 1. James McManus
2. Mark Bradley
828 0.24 −0.55
Great Australian 1. Benny Tilbury
2. Bradley Ward
820 0.23 +0.23
Independent Hayley Doan 494 0.14 +0.14
Total formal votes 352,173 97.75 +0.66
Informal votes 8,098 2.25 −0.66
Turnout 360,271 85.02 −2.19

Mining and Pastoral

2021 Western Australian state election: Mining and Pastoral[4]
Party Candidate Votes % ±%
Quota 7,010
Labor 1. Stephen Dawson (elected 1)
2. Kyle McGinn (elected 2)
3. Peter Foster (elected 3)
4. Rosetta Sahanna (elected 4)
5. Kelvin Portland
6. Bobby-Lee Field
28,002 57.07 +22.91
Liberal 1. Neil Thomson (elected 6)
2. Michael Huston
3. Jodie Richardson
4. Matt Blampey
5,250 10.70 −4.99
National 1. Nicholas Fardell
2. Lionel Quartermaine
3. Tony Crook
4. Kieran Dart
5. Mark Young
6. Tessa Daly
5,032 10.26 −8.72
Greens 1. Kimberly Smith
2. Giz Watson
2,431 4.95 −0.72
Shooters, Fishers, Farmers 1. Matt Priest
2. Royce Normington
3. Kingsley Smith
1,705 3.48 −1.67
One Nation 1. Robin Scott
2. David Modolo
1,490 3.04 −10.66
Legalise Cannabis 1. James Brown
2. Donald Watt
1,277 2.60 +2.60
Western Australia 1. Dave Grills
2. Julie Matheson
729 1.49 +1.22
Christians 1. Jacky Young
2. Ross Patterson
582 1.19 −0.32
Liberals for Climate 1. Curtis Greening
2. Gavin McFerran
552 1.13 +0.10
No Mandatory Vaccination 1. Andrew Middleton
2. Deborah Middleton
526 1.07 +1.07
Animal Justice 1. Emmarae Cole-Darby
2. Scott Dunning
398 0.81 +0.81
Liberal Democrats 1. Robbie Parr
2. Jake McCoull
198 0.40 −0.29
Independent 1. Tayla Squires
2. Cameron Gardiner
188 0.38 +0.38
Sustainable Australia 1. Brian Mollan
2. Anthony Park
158 0.32 +0.32
WAxit 1. Brenden Hatton
2. Huw Grossmith
116 0.24 +0.10
Great Australian 1. Nathan Webb-Smith
2. Laona Mullings
113 0.23 +0.23
Daylight Saving 1. Wilson Tucker (elected 5)
2. Janet Wilson
98 0.20 −0.30
Independent 1. Anthony Fels
2. Van Son Le
85 0.17 +0.17
Health Australia 1. Teddy Craies
2. Simon Martin
82 0.17 +0.17
Independent 1. Christine Kelly
2. Noel McGinniss
52 0.11 +0.11
Total formal votes 49,064 97.83 +0.74
Informal votes 1,088 2.17 −0.74
Turnout 50,152 72.00 −15.20

North Metropolitan

2021 Western Australian state election: North Metropolitan[5]
Party Candidate Votes % ±%
Quota 52,319
Labor 1. Pierre Yang (elected 1)
2. Martin Pritchard (elected 3)
3. Ayor Makur Chuot (elected 4)
4. Dan Caddy (elected 5)
5. Rhys Vallance
6. Rebeka Marton
215,054 58.72 +21.50
Liberal 1. Peter Collier (elected 2)
2. Tjorn Sibma (elected 6)
3. Simon Ehrenfeld
4. Tim Walton
5. Michael Mischin
85,379 23.31 −13.16
Greens 1. Alison Xamon
2. Daniel Vujcich
3. Sarah Newbold
27,077 7.39 −2.58
Christians 1. Louis Hildebrandt
2. Neil Fearis
6,242 1.70 +0.10
Legalise Cannabis 1. Max Armstrong-Moore
2. Fred Mulholland
5,380 1.47 +1.47
One Nation 1. Tyler Walsh
2. Sheila Mundy
5,069 1.38 −5.08
No Mandatory Vaccination 1. James Pearce
2. A. Cirkovic
3. Sara O'Dal
4,550 1.24 +1.24
Western Australia 1. Elizabeth Re
2. Steven Pynt
2,669 0.73 +0.13
Animal Justice 1. Michael Anagno
2. Stephanie Fry
2,593 0.71 −0.48
Shooters, Fishers, Farmers 1. Jan Van Niekerk
2. Marty Wenham
2,399 0.66 −0.64
Liberal Democrats 1. Kate Fantinel
2. Richard Tait
1,419 0.39 −0.70
Independent 1. Rafe Roberts
2. Carel Husselmann
1,335 0.36 +0.36
Liberals for Climate 1. Daithi Gleeson
2. Paul Holliday
1,268 0.35 −0.09
WAxit 1. John Golawski
2. Aleksandra Sommer
1,248 0.34 −0.27
Sustainable Australia 1. Colin Scott
2. Michael Ferrinda
974 0.27 +0.27
Daylight Saving 1. Robert Tucker
2. Heather Atcheson
888 0.24 −0.56
Great Australian 1. Chris Irwin
2. Ben Tonkin
721 0.20 +0.20
Health Australia 1. Sanjeev Gupta
2. George Helou
577 0.16 +0.16
1. Michael Tucak
2. John Tucak
482 0.13 −0.15
Independent 1. Andrea Randle
2. Wvendy Chan
467 0.13 +0.13
Independent 1. Billy Amesz
2. Steven Gersbach
174 0.05 +0.05
Independent T. Ravichandar 148 0.04 +0.04
Independent 1. N. Spada
2. M. Husselmann
116 0.03 +0.03
Total formal votes 366,229 98.49 +1.40
Informal votes 5,633 1.51 −1.40
Turnout 371,862 86.93 −0.28

South Metropolitan

2021 Western Australian state election: South Metropolitan[6]
Party Candidate Votes % ±%
Quota 54,302
Labor 1. Sue Ellery (elected 1)
2. Kate Doust (elected 3)
3. Klara Andric (elected 4)
4. Stephen Pratt (elected 5)
5. Victoria Helps
6. Kelly McManus
239,248 62.94 +18.08
Liberal 1. Nick Goiran (elected 2)
2. Michelle Hofmann
3. Ka-ren Chew
4. Robert Reid
5. Nitin Vashisht
6. Scott Stirling
67,000 17.63 −7.22
Greens 1. Brad Pettitt (elected 6)
2. Lynn MacLaren
3. Daniel Garlett
26,257 6.91 −2.34
Christians 1. Warnar Spyker
2. Sylvia Iradukunda
7,290 1.92 −0.06
Legalise Cannabis 1. Moshe Bernstein
2. Scott Shortland
6,877 1.81 +1.81
One Nation 1. Philip Scott
2. Bradley Dickinson
3,972 1.04 −5.95
Shooters, Fishers, Farmers 1. Steven Tonge
2. Paul Bedford
3,920 1.03 −0.47
No Mandatory Vaccination 1. Cam Tinley
2. Michael Fletcher
3. Greg Bell
3,842 1.01 +1.01
Liberal Democrats 1. Aaron Stonehouse
2. Harvey Smith
3. Jared Neaves
4. Ivan Tomshin
5. Laurentiu Zamfirescu
6. Peter Leech
3,369 0.89 −3.02
Liberals for Climate 1. Keith Pomeroy
2. Daniel Herron
3,262 0.86 +0.49
Animal Justice 1. Colleen Saporita
2. Katrina Love
3,033 0.80 −0.48
Western Australia 1. Katy Mair
2. Gavin Waugh
2,312 0.61 +0.27
Independent 1. Graham West
2. Liam Strickland
1,683 0.44 +0.44
WAxit 1. Peter McLernon
2. Jo-Anne Vincent-Barwood
1,341 0.35 −0.33
Daylight Saving 1. Amanda Klaj
2. Craig Curtis
1,319 0.35 −0.45
Sustainable Australia 1. Ryan Oostryck
2. Jane Loveday
1,169 0.31 +0.31
Great Australian 1. Samantha Vinci
2. Susan Hoddinott
1,097 0.29 +0.29
Socialist Alliance 1. Marianne Mackay
2. Dirk Kelly
948 0.25 −0.14
Health Australia 1. Michele Castle
2. Catheryn Wright
646 0.17 +0.17
Independent Larry Foley 397 0.10 +0.10
Independent 1. Jourdan Kestel
2. Lee Herridge
371 0.10 +0.10
Independent 1. Mark Rowley
2. Marlie Touchell
273 0.07 +0.07
Independent 1. Glen Leslie
2. Stephen Yarwood
202 0.05 +0.05
Independent 1. Stan Francis
2. Jeremy Lay
160 0.04 +0.04
Independent 1. Dave Glossop
2. Lewis Butto
112 0.03 +0.03
Independent Leon Hamilton 10 0.00 +0.00
Total formal votes 380,110 98.08 +0.99
Informal votes 7,432 1.92 −0.99
Turnout 387,542 86.28 −0.93

South West

2021 Western Australian state election: South West[7]
Party Candidate Votes % ±%
Quota 29,300
Labor 1. Sally Talbot (elected 1)
2. Alannah MacTiernan (elected 3)
3. Jackie Jarvis (elected 4)
4. John Mondy
5. Ben Dawkins
6. Kylie Fitzgerald
114,713 55.93 +19.49
Liberal 1. Steve Thomas (elected 2)
2. Greg Stocks
3. Anita Shortland
4. Hayden Burbidge
37,736 18.40 −4.28
National 1. James Hayward (elected 6)
2. Louise Kingston
3. Rod Pfeiffer
12,254 5.97 −6.06
Greens 1. Diane Evers
2. Donald Clarke
3. Jodie Moffat
12,220 5.96 −1.62
Shooters, Fishers, Farmers 1. Rick Mazza
2. Russell McCarthy
3. Ray Hull
5,178 2.52 −1.59
Legalise Cannabis 1. Sophia Moermond (elected 5)
2. Nicola Johnson
4,531 2.21 +2.21
One Nation 1. Colin Tincknell
2. Paul Howard
3. Michael Pelle
3,841 1.87 −8.76
Christians 1. Laurence Van der Plas
2. Joan Albany
3,782 1.84 +0.15
No Mandatory Vaccination 1. Keith Bunton
2. Elisabeth Bluntschli
2,504 1.22 +1.22
Liberal Democrats 1. Eli Bernstein
2. David Fishlock
2,014 0.98 +0.03
Western Australia 1. Terri Sharp
2. Joanne Munro
1,420 0.69 +0.55
Sustainable Australia 1. Daniel Minson
2. Heather Scott
904 0.44 +0.44
WAxit 1. Chas Hopkins
2. Malcolm Gilmour
810 0.39 +0.20
Animal Justice 1. Vicki Bailey
2. Sarah Gould
798 0.39 −0.40
Health Australia 1. Justin Zwartkruis
2. Hayley Green
493 0.24 +0.24
Great Australian 1. Nick Robinson
2. Andy Gleeson
461 0.22 +0.22
Liberals for Climate 1. Mark Bentley
2. Pieter Lottering
410 0.20 −0.23
Daylight Saving 1. Garry Spiers
2. Lizabeth Taylor
283 0.14 −0.22
Independent 1. Yasmin Bartlett
2. Karen Perttula
242 0.12 +0.12
Independent Dave Schumacher 170 0.08 +0.08
Independent 1. George Seth
2. Noel Avery
145 0.07 +0.07
Independent 1. John Banks
2. Phillip Spencer
101 0.05 +0.05
Independent Bob Burdett 89 0.04 +0.04
Total formal votes 205,099 97.92 +0.83
Informal votes 4,357 2.08 −0.83
Turnout 209,456 86.20 −1.00

References

  1. ^ "2021 State General Election Results". Western Australian Electoral Commission. Retrieved 14 March 2021.
  2. ^ "2021 State General Election Results: Agricultural Region". Western Australian Electoral Commission. Retrieved 1 April 2021.
  3. ^ "2021 State General Election Results: East Metropolitan Region". Western Australian Electoral Commission. Retrieved 1 April 2021.
  4. ^ "2021 State General Election Results: Mining and Pastoral Region". Western Australian Electoral Commission. Retrieved 1 April 2021.
  5. ^ "2021 State General Election Results: North Metropolitan Region". Western Australian Electoral Commission. Retrieved 1 April 2021.
  6. ^ "2021 State General Election Results: South Metropolitan Region". Western Australian Electoral Commission. Retrieved 1 April 2021.
  7. ^ "2021 State General Election Results: South West Region". Western Australian Electoral Commission. Retrieved 1 April 2021.