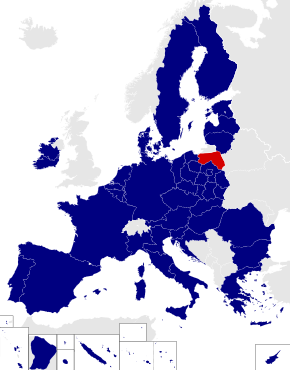
Podlaskie and Warmian–Masurian (European Parliament constituency) Constituency of the European Parliament
Podlaskie and Warmian-Masurian Location among the current constituencies
Member state Poland Created 2004 MEPs 2 (since 2024) (2004-2019) [1]
Podlaskie and Warmian-Masurian (Polish : podlaskie i warmińsko-mazurskie ) is a constituency of the European Parliament . It consists of the Podlaskie Voivodeship and Warmian-Masurian Voivodeship .
The chief cities are Elbląg , Olsztyn and Białystok .
Nomenclature
The relevant Polish legislation ("The Act of 23 January 2004 on Elections to the European Parliament"[ 1] [ 2] [ 3]
Members of the European Parliament
Election results
2004
2004 European Parliament election Electoral committee Votes % Seats Civic Platform 95,106 26.99 1 League of Polish Families 65,926 18.71 1 Self-Defence of the Republic of Poland 45,717 12.97 – Law and Justice 40,412 11.47 – Democratic Left Alliance – Labour Union 31,120 8.83 – Polish People's Party 18,796 5.33 – Social Democracy of Poland 13,308 3.78 – Freedom Union 12,906 3.66 – National Electoral Committee 6,371 1.81 – Initiative for Poland 5,356 1.52 – Real Politics Union 4,108 1.17 – Konfederacja Ruch Obrony Bezrobotnych 3,667 1.04 – KPEiR –PLD 3,364 0.95 – All-Poland Civic Coalition 3,134 0.89 – Polish Labour Party 2,368 0.67 – Polish National Party 772 0.22 – Total 352,431 100.00 2 Valid votes 352,431 97.23 Invalid/blank votes 10,045 2.77 Total votes 362,476 100.00 Registered voters/turnout 2,058,081 17.61 Source: PKW
2009
2009 European Parliament election Electoral committee Votes % Seats Civic Platform 159,943 38.31 1 Law and Justice 121,921 29.20 1 Democratic Left Alliance – Labour Union 59,194 14.18 – Polish People's Party 38,012 9.11 – Agreement for the Future – CenterLeft 8,596 2.06 – Self-Defence of the Republic of Poland 8,534 2.04 – Right Wing of the Republic 7,317 1.75 – Real Politics Union 5,050 1.21 – Libertas Poland 4,355 1.04 – Polish Labour Party 3,230 0.77 – Polish Socialist Party 1,331 0.32 – Total 417,483 100.00 2 Valid votes 417,483 98.23 Invalid/blank votes 7,521 1.77 Total votes 425,004 100.00 Registered voters/turnout 2,104,242 20.20 Source: National Electoral Commission [ 4]
2014
2014 European Parliament election Electoral committee Votes % Seats Law and Justice 140,342 35.53 1 Civic Platform 105,541 26.72 1 Democratic Left Alliance – Labour Union 41,422 10.49 – Polish People's Party 36,221 9.17 – Congress of the New Right 28,412 7.19 – Europa Plus —Your Movement 13,330 3.37 – United Poland 10,209 2.58 – Poland Together 10,010 2.53 – National Movement 6,462 1.64 – Direct Democracy 1,574 0.40 – Self-Defence 1,517 0.38 – Total 395,040 100.00 2 Valid votes 395,040 96.81 Invalid/blank votes 13,031 3.19 Total votes 408,071 100.00 Registered voters/turnout 2,110,287 19.34 Source: National Electoral Commission [ 5]
2019
2019 European Parliament election Electoral committee Votes % Seats Law and Justice 375,001 47.29 2 European Coalition 293,677 37.03 1 Spring 45,424 5.73 – Confederation 38,866 4.90 – Kukiz'15 28,512 3.60 – Left Together 11,517 1.45 – Total 792,997 100.00 3 Valid votes 792,997 99.14 Invalid/blank votes 6,849 0.86 Total votes 799,846 100.00 Registered voters/turnout 2,054,446 38.93 Source: National Electoral Commission [ 6] [ 7]
2024
2024 European Parliament election Electoral committee Votes % Seats Civic Coalition 256,889 37.36 1 Law and Justice 252,638 36.75 1 Confederation 87,388 12.71 0 Third Way 54,087 7.87 0 The Left 24,776 3.60 0 Bezpartyjni Samorządowcy 6,951 1.01 0 Normal Country 3,054 0.44 0 PolExit 1,743 0.25 0 Total 687,526 100.00 2 Valid votes 687,526 99.30 Invalid/blank votes 4,849 0.70 Total votes 692,375 100.00 Registered voters/turnout 1,960,434 35.32 Source: National Electoral Commission [ 8]
References
External links

