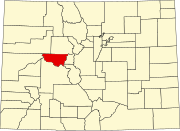
Unincorporated community in Pitkin County, Colorado, United States
Census Designated Place in Colorado, United States
Norrie (also known as the Norrie Colony) is a census-designated place (CDP) located in and governed by Pitkin County , Colorado , United States . The population of the Norrie CDP was 7 at the United States Census 2020 .[ 3] Meredith post office (Zip Code 81642) serves the area.[ 4] Glenwood Springs, CO Micropolitan Statistical Area .
History
Norrie was originally settled in the late 1880s. It began as a camp for railroad workers building the Colorado Midland Railway route along the Fryingpan River . The workers harvested trees used in the railroad construction, and they made ice in the local ponds, ice used in the railroad's refrigerator cars. Now, many privately-owned summer cabins line the community's quiet streets.[ 5]
Geography
The Norrie CDP has an area of 120 acres (0.487 km2 ), all land.[ 2]
Climate
The weather station at Nast Lake is 3 miles (4.83 km) south-east of Norrie, at an elevation of 8,700 feet (2,652 m).
Climate data for Nast Lake, Colorado, 1991–2020 normals, 1985-2020 extremes: 8700ft (2652m)
Month
Jan
Feb
Mar
Apr
May
Jun
Jul
Aug
Sep
Oct
Nov
Dec
Year
Record high °F (°C)
67
63
75
76
87
91
94
93
88
80
71
51
94
Mean maximum °F (°C)
52
55
61
67
77
84
87
85
81
72
61
51
88
Mean daily maximum °F (°C)
36.5
40.2
47.5
52.5
62.4
74.0
79.2
76.0
69.4
57.6
45.2
36.1
56.4
Daily mean °F (°C)
19.1
22.3
30.1
36.5
45.0
53.7
59.3
57.1
50.5
40.3
29.2
19.2
38.5
Mean daily minimum °F (°C)
1.4
4.2
12.5
20.4
28.3
33.5
39.4
38.0
31.5
23.0
12.7
2.2
20.6
Mean minimum °F (°C)
−18
−16
−7
5
19
26
32
31
22
7
−8
−18
−21
Record low °F (°C)
−32
−31
−20
−7
8
19
19
12
7
−10
−23
−32
−32
Average precipitation inches (mm)
2.10
1.99
2.18
2.64
1.81
0.90
1.46
1.54
1.29
1.54
1.86
1.83
21.14
Source 1: XMACIS2[ 6]
Source 2: NOAA (Precipitation)[ 7]
Demographics
The United States Census Bureau initially defined the Norrie CDP for the United States Census 2010 .
See also
References
^ a b c d U.S. Geological Survey Geographic Names Information System: Norrie, Colorado ^ a b "State of Colorado Census Designated Places - BAS20 - Data as of January 1, 2020" . United States Census Bureau . Retrieved December 26, 2020 .^ a b United States Census Bureau. "Norrie CDP, Colorado" . Retrieved April 10, 2023 . ^ a b "Look Up a ZIP Code" . United States Postal Service . Retrieved December 26, 2020 .^ "Fryingpan Valley and Ruedi Reservoir visitor's guide" (PDF) . Roaring Fork Conservancy . Retrieved October 23, 2020 .^
"xmACIS2" . National Oceanic and Atmospheric Administration. Retrieved November 3, 2023 .
^
"Nast Lake, Colorado 1991-2020 Monthly Normals" . Retrieved November 3, 2023 .
External links


