List of Irish counties by population
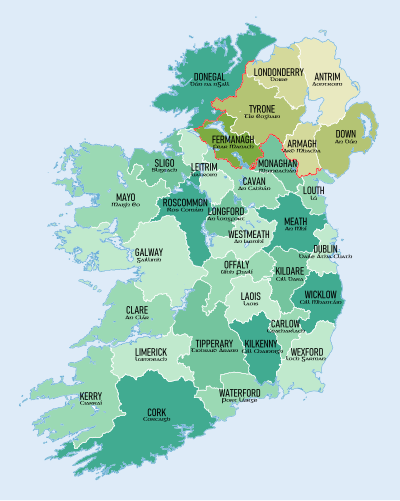
The 32 traditional counties of Ireland This is a list of counties of Ireland ordered by population. Counties in the Republic of Ireland are shown in normal type, while those in Northern Ireland are listed in italic type. Non-traditional administrative counties are indicated by a cream-coloured background.
For a more detailed analysis of current and historical Irish populations in the Republic of Ireland, see Irish population analysis . The population of the six counties of Northern Ireland as of 2021 is 1,903,100[ 1]
Data source (as of June 2023):
Taken from latest census data for the Republic of Ireland [ 2] Northern Ireland .[ 3]
Population data for counties in the Republic of Ireland is based on data from the 2022 census .
Population data for counties in Northern Ireland is based on the 2021 census.
The previous census for the Republic of Ireland was taken in 2016, the previous census for Northern Ireland was taken in 2011.
Density updated as of 2021 for Northern Ireland and 2022 for the Republic of Ireland.
Rank
County
Population
Density
Province
Change since
Change per year
per km2
per sq mi
1
Dublin
1,458,154
1,581.5
4,096
Leinster
7.7%
1.28%
2
Antrim 651,321
211.1
547
Ulster
5.1%
0.51%
3
Cork
584,156
77.5
201
Munster
7.1%
1.18%
4
Down 553,261
222.3
576
Ulster
3.9%
0.39%
–
Fingal
330,506
724.8
1,877
Leinster
11.2%
1.86%
–
South Dublin
301,705
1,354.5
3,508
Leinster
7.5%
1.25%
5
Galway
277,737
45.1
117
Connacht
7.1%
1.18%
6
Londonderry 252,231
119.1
308
Ulster
2.0%
0.20%
7
Kildare
247,774
146.2
379
Leinster
11.0%
1.83%
–
Dún Laoghaire–Rathdown
233,860
1,859.0
4,815
Leinster
7.1%
1.18%
8
Meath
220,826
94.3
244
Leinster
12.9%
2.15%
9
Limerick
209,536
76.0
197
Munster
5.4%
0.9%
10
Armagh 194,394
146.5
379
Ulster
10.1%
1.01%
11
Tyrone 188,383
57.6
149
Ulster
5.5%
0.55%
12
Tipperary
167,895
39.0
101
Munster
5.1%
0.85%
13
Donegal
167,084
34.4
89
Ulster
4.5%
0.75%
14
Wexford
163,919
69.3
179
Leinster
9.2%
1.53%
15
Kerry
156,458
32.5
84
Munster
5.1%
0.85%
16
Wicklow
155,851
76.9
199
Leinster
9.2%
1.53%
17
Louth
139,703
169.1
438
Leinster
7.9%
1.31%
18
Mayo
137,970
24.7
64
Connacht
5.2%
0.87%
19
Clare
127,938
37.1
96
Munster
7.2%
1.2%
20
Waterford
127,363
68.6
178
Munster
9.4%
1.57%
21
Kilkenny
104,160
50.2
130
Leinster
4.5%
0.75%
22
Westmeath
96,221
52.3
135
Leinster
8.0%
1.33%
23
Laois
91,877
53.4
138
Leinster
8.2%
1.37%
24
Offaly
83,150
41.6
108
Leinster
6.0%
1.0%
25
Cavan
81,704
42.3
110
Ulster
6.6%
1.1%
26
Roscommon
70,259
27.6
71
Connacht
8.4%
1.4%
27
Sligo
70,198
38.2
99
Connacht
6.5%
1.08%
28
Monaghan
65,288
50.4
131
Ulster
5.6%
0.93%
29
Fermanagh 63,585
37.6
97
Ulster
3.8%
0.38%
30
Carlow
61,968
69.1
179
Leinster
8.8%
1.47%
31
Longford
46,751
42.9
111
Leinster
14.1%
2.35%
32
Leitrim
35,199
21.9
57
Connacht
9.5%
1.58%
Total
Island of Ireland
7,052,314
83.5
216
—
Average
220,385
—
—
—
—
See also
Notes
The populations of Dublin , Cork , Galway , Limerick and Waterford cities are included with the respective traditional counties. For a list of these cities and their suburbs by population see, List of urban areas in the Republic of Ireland City status in Ireland
References
Census in Ireland
Censuses
All-island Republic of Ireland Northern Ireland
Future
2026 (Republic of Ireland)
2031 (Northern Ireland) Population lists See also
