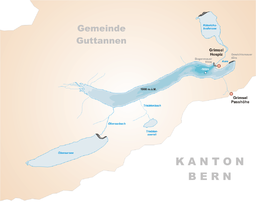
Artificial lake in the Canton of Bern, Switzerland
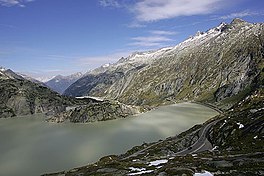
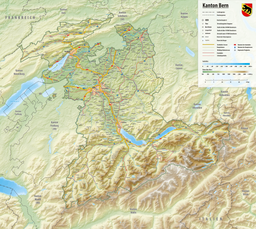
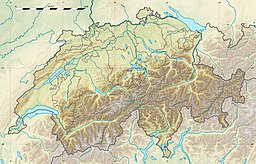
The Grimselsee or Lake Grimsel is an artificial lake near the Grimsel Pass in the Canton of Bern, Switzerland. With a volume of 95 mio m3 (20.9 billion imperial gallons, 20.1 billion US gallons), it is larger than other hydroelectric reservoirs in the Aare headwaters region: Oberaarsee, Räterichsbodensee and Gelmersee. The dam was completed in 1932 and is operated by Kraftwerke Oberhasli AG (KWO). It is located in the municipality of Guttannen.
Climate
| Climate data for Grimselsee (Grimsel Hospiz), elevation 1,980 m (6,500 ft), (1991–2020)
|
| Month
|
Jan
|
Feb
|
Mar
|
Apr
|
May
|
Jun
|
Jul
|
Aug
|
Sep
|
Oct
|
Nov
|
Dec
|
Year
|
| Mean daily maximum °C (°F)
|
−1.8
(28.8)
|
−2.0
(28.4)
|
0.3
(32.5)
|
3.0
(37.4)
|
7.3
(45.1)
|
11.4
(52.5)
|
13.2
(55.8)
|
13.3
(55.9)
|
9.7
(49.5)
|
6.8
(44.2)
|
1.7
(35.1)
|
−0.9
(30.4)
|
5.2
(41.4)
|
| Daily mean °C (°F)
|
−4.5
(23.9)
|
−4.9
(23.2)
|
−2.6
(27.3)
|
0.2
(32.4)
|
4.3
(39.7)
|
8.2
(46.8)
|
10.2
(50.4)
|
10.3
(50.5)
|
6.9
(44.4)
|
4.0
(39.2)
|
−0.7
(30.7)
|
−3.5
(25.7)
|
2.3
(36.1)
|
| Mean daily minimum °C (°F)
|
−7.4
(18.7)
|
−7.9
(17.8)
|
−5.5
(22.1)
|
−2.7
(27.1)
|
1.3
(34.3)
|
4.9
(40.8)
|
7.0
(44.6)
|
7.3
(45.1)
|
4.2
(39.6)
|
1.4
(34.5)
|
−3.1
(26.4)
|
−6.2
(20.8)
|
−0.6
(30.9)
|
| Average precipitation mm (inches)
|
190.1
(7.48)
|
163.2
(6.43)
|
169.1
(6.66)
|
150.2
(5.91)
|
158.6
(6.24)
|
127.3
(5.01)
|
126.3
(4.97)
|
139.4
(5.49)
|
128.6
(5.06)
|
129.3
(5.09)
|
167.8
(6.61)
|
184.1
(7.25)
|
1,834
(72.20)
|
| Average snowfall cm (inches)
|
203.9
(80.3)
|
192.7
(75.9)
|
202.3
(79.6)
|
151.4
(59.6)
|
74.9
(29.5)
|
21.7
(8.5)
|
3.3
(1.3)
|
5.2
(2.0)
|
21.3
(8.4)
|
53.8
(21.2)
|
149.5
(58.9)
|
179.6
(70.7)
|
1,259.6
(495.9)
|
| Average precipitation days (≥ 1.0 mm)
|
12.1
|
11.8
|
13.2
|
12.5
|
13.9
|
14.6
|
13.4
|
13.8
|
11.3
|
10.8
|
11.6
|
12.7
|
151.7
|
| Average relative humidity (%)
|
65.9
|
68.2
|
73.1
|
75.6
|
74.6
|
76.1
|
75.3
|
75.8
|
75.6
|
70.0
|
71.3
|
66.6
|
72.3
|
| Mean monthly sunshine hours
|
71.6
|
95.2
|
128.7
|
123.0
|
135.3
|
185.2
|
177.7
|
169.1
|
139.8
|
114.9
|
64.1
|
57.0
|
1,434.6
|
| Source: NOAA[1]
|
See also
External links
References
