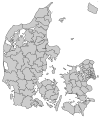
Greve Municipality

Greve Municipality
Greve Kommune (Danish)
Coat of arms of Greve Municipality
Coordinates: 55°35′02″N 12°17′43″E / 55.5839°N 12.2953°E / 55.5839; 12.2953
CountryDenmark
RegionZealand
Established1 April 1970
SeatGreve Strand
Government
 • MayorPernille Beckmann (V)
Area
 • Total
60.18 km2 (23.24 sq mi)
Population
 (1. January 2024)[1]
 • Total
52,157
 • Density870/km2 (2,200/sq mi)
Time zoneUTC+1 (CET)
 • Summer (DST)UTC+2 (CEST)
Municipal code253
Websitewww.greve.dk Edit this at Wikidata

Greve Municipality (Danish: Greve Kommune is a kommune about 21 km south-west of Copenhagen in Region Sjælland on the east coast of the island of Zealand (Sjælland) in eastern Denmark. The municipality covers an area of 60 km2, and has a total population of 52,157 (2024).

The site of its municipal council is the town of Greve Strand.

It serves primarily as a residential municipality, functioning as a suburb for the larger Copenhagen area.

History

Until the 1960s the area was primarily agricultural, and most businesses in town were concentrated along the coastal road "Strandvejen". With numerous holiday cottages near the coast of Køge Bugt (Køge Bay), this was also the destination for many inhabitants of Copenhagen on holiday away from the hustle and bustle of the city.

During the late 1960s and into the 1970s, many people moved permanently out of Copenhagen and into new homes in places like Greve. What was formerly farmers' fields quickly turned into districts of detached houses, whilst most of the shops and similar businesses near the coastal road moved into central shopping malls such as Hundige Storcenter and Greve Midtby Center. Around 1980 the S-train railroad network was expanded towards Køge, and the stations Greve and Hundige were placed adjacent to the shopping malls.

Greve Municipality was formed in 1970, as part of the kommunalreform ("Municipal Reform") of that year. It was established by combining the following parishes:

Greve municipality was one of the municipalities that was not merged 1 January 2007 in the nationwide Kommunalreformen ("The Municipal Reform" of 2007).

Locations

Greve Strand 43,300
Tune 5,300
Greve Landsby 720
Kildebrønde 380

Politics

Greve's municipal council consists of 21 members, elected every four years. The municipal council has six political committees.[2]

National results

Blue Bloc Red Bloc Other
1998[3] 17,629 (58.5%) 12,429 (41.3%) 63 (0.2%)
2001[4] 20,235 (65.7%) 10,542 (34.3%) 0 (0%)
2005[5] 18,764 (64.2%) 10,109 (34.6%) 355 (1.2%)
2007[6] 19,482 (64.9%) 10,558 (35.1%) 0 (0%)
2011[6] 18,938 (62.2%) 11,529 (37.8%) 4 (0%)
2015[6] 18,986 (62.5%) 11,369 (37.4%) 16 (0.1%)
2019[6] 15,658 (51.6%) 13,147 (43.3%) 1,552 (5.1%)

Municipal council

Below are the municipal councils elected since the Municipal Reform of 2007.

2005 election results

2005 local election results:

PartyVotes%+/–Seats
Venstre10,17041.55–5.08
Social Democrats6,68227.30+1.16
Danish People's Party2,65310.84+1.62
The Conservative People's Party2,0558.40+0.62
Socialist People's Party1,0884.44–1.31
Danish Social Liberal Party9874.03+4.01
Borgerlisten3581.46+1.5
Red–Green Alliance3041.24+1.2
Other1800.74
Total24,477100.0020
Registered voters/turnout35,88668.8%
Source: KMD, KMD

2009 election results

2009 local election results:

PartyVotes%+/–Seats+/–
Venstre8,44935.40–6.180
Social Democrats5,61023.51–3.85–1
The Conservative People's Party3,78615.86+7.54+2
Socialist People's Party2,66911.18+6.82+1
Danish People's Party2,63211.03+0.220
Danish Social Liberal Party4591.92–2.1–1
Borgerlisten1840.77–0.7
Other750.31–0.4
Total23,864100.0021
Registered voters/turnout35,99767.0
Source: KMD, KMD

2013 election results

2013 local election results:

PartyVotes%+/–Seats+/–
Venstre9,78236.33+0.99+1
Social Democrats5,86621.79–1.750
Danish People's Party4,22815.70+4.73+1
The Conservative People's Party2,5109.32–6.62–2
Red–Green Alliance9883.67+3.71+1
Borgerliberale i Greve9153.40+3.4+0
Socialist People's Party9133.39–7.8–2
Liberal Alliance6172.29+2.31+1
Tune Borgerliste5862.18+3.4
Danish Social Liberal Party5211.930.0
Total26,926100.0021
Registered voters/turnout36,93574.2
Source: KMD, KMD

2017 election results

2017 local election results:

PartyVotes%+/–Seats+/–
Venstre9,95136.59+0.390
Social Democrats7,86128.91+7.17+2
Danish People's Party3,27412.04–3.72–1
The Conservative People's Party1,4005.15–4.21–1
Red–Green Alliance1,1024.05+0.310
Liberal Alliance8863.26+0.910
Socialist People's Party6712.47–0.9
Danish Social Liberal Party4091.50–0.4
Other1,6396.03
Total27,193100.0021
Registered voters/turnout38,61071.3
Source: KMD, KMD

2021 election results

2021 local election results:

PartyVotes%+/–Seats+/–
Venstre9,57537.70+1.1190
Social Democrats6,94127.33–1.586–1
The Conservative People's Party3,05512.03+6.882+1
Danish People's Party1,5706.18–5.861–1
Red–Green Alliance1,1364.47+0.4210
New Right9743.84+3.841+1
Socialist People's Party9543.76+1.291+1
Danish Social Liberal Party5392.12+0.620–1
Liberal Alliance1890.74–2.52
Other4641.83–4.20
Total25,397100.0021
Registered voters/turnout39,33165.4
Source: KMD, KMD

References

  1. ^ BY2: Population 1. January by municipalities The Mobile Statbank from Statistics Denmark
  2. ^ Greve.dk "Byråd og udvalg" Retrieved 28 April 2019
  3. ^ "Folketingsvalget den 11. marts 1998" (PDF) (in Danish). pp. 78 & 88. Retrieved 18 November 2019.
  4. ^ "Folketingsvalget den 20. november 2001" (PDF). Ministry of Interior and Health (in Danish). 31 March 2003. pp. 74, 84. Retrieved 18 November 2019.
  5. ^ "Folketingsvalget den 8. februar 2005" (PDF) (in Danish). p. 97. Retrieved 18 November 2019.
  6. ^ a b c d "Election to the Parliament by result of the election and municipalities (2007-2019)". Statistics of Denmark. Retrieved 18 November 2019.