Châteaudun

Châteaudun
Chateau
Chateau
Coat of arms of Châteaudun
Location of Châteaudun
Map
Châteaudun is located in France
Châteaudun
Châteaudun
Châteaudun is located in Centre-Val de Loire
Châteaudun
Châteaudun
Coordinates: 48°04′18″N 1°20′19″E / 48.0717°N 1.3387°E / 48.0717; 1.3387
CountryFrance
RegionCentre-Val de Loire
DepartmentEure-et-Loir
ArrondissementChâteaudun
CantonChâteaudun
Government
 • Mayor (2020–2026) Fabien Verdier[1]
Area
1
28.48 km2 (11.00 sq mi)
Population
 (2022)[2]
12,898
 • Density450/km2 (1,200/sq mi)
Time zoneUTC+01:00 (CET)
 • Summer (DST)UTC+02:00 (CEST)
INSEE/Postal code
28088 /28200
Elevation102–152 m (335–499 ft)
(avg. 140 m or 460 ft)
1 French Land Register data, which excludes lakes, ponds, glaciers > 1 km2 (0.386 sq mi or 247 acres) and river estuaries.

Châteaudun (French pronunciation: [ʃɑtodœ̃]) is a commune in the Eure-et-Loir department in northern France. It is a sub-prefecture of the department. It was the site of the Battle of Châteaudun during the Franco-Prussian War.

Geography

Châteaudun is located about 45 km northwest of Orléans, and about 50 km south-southwest of Chartres. It lies on the river Loir, a tributary of the Sarthe.

History
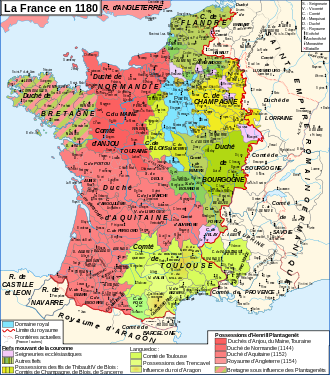
France in 1180 when Angevin kings of England held all the red territories and Chateudun lay near its border.

Châteaudun (Latin Castrodunum), which dates from the Gallo-Roman period, was in the middle ages the capital of the County of Dunois.[3]

The streets, which radiate from a central square, have a uniformity due to the reconstruction of the town after fires in 1723 and 1870.[3]

Employment

The area is rich agricultural land, but a major local employer is the Châteaudun Air Base just to the east of the town, and much larger than the town itself.

Population

Historical population
YearPop.±% p.a.
1793 5,957—    
1800 6,046+0.21%
1806 6,161+0.31%
1821 6,042−0.13%
1831 6,461+0.67%
1836 6,776+0.96%
1841 6,580−0.59%
1846 6,788+0.62%
1851 6,745−0.13%
1856 6,542−0.61%
1861 6,719+0.54%
1866 6,781+0.18%
1872 6,552−0.57%
1876 6,694+0.54%
1881 7,036+1.00%
1886 7,284+0.70%
1891 7,147−0.38%
1896 7,460+0.86%
YearPop.±% p.a.
1901 7,146−0.86%
1906 7,147+0.00%
1911 7,296+0.41%
1921 6,587−1.02%
1926 6,558−0.09%
1931 6,790+0.70%
1936 7,057+0.77%
1946 8,145+1.44%
1954 9,687+2.19%
1962 11,982+2.69%
1968 14,450+3.17%
1975 15,338+0.86%
1982 15,319−0.02%
1990 14,511−0.68%
1999 14,543+0.02%
2007 13,963−0.51%
2012 13,039−1.36%
2017 13,195+0.24%
Source: EHESS[4] and INSEE (1968-2017)[5]

Main sights

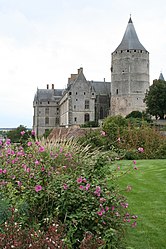
The town has a château, founded in the 10th century,[3] known for being the first on the road to Loire Valley from Paris. Châteaundun also has a museum, the "Musée des beaux arts et d'histoire naturelle". The museum is diverse, the most popular exhibition being the big collection of stuffed birds. In addition, there are often temporary exhibitions, recent examples including the war of Asia, ancient Egypt and insects.[6]

Churches

Medieval houses

Personalities

Châteaudun was the birthplace of:

Twin towns - sister cities

Châteaudun is twinned with:[7]

Climate

Climate data for Châteaudun (1991–2020 normals, extremes 1952–present)
Month Jan Feb Mar Apr May Jun Jul Aug Sep Oct Nov Dec Year
Record high °C (°F) 15.7
(60.3)
21.0
(69.8)
25.4
(77.7)
28.0
(82.4)
32.1
(89.8)
37.8
(100.0)
41.7
(107.1)
39.3
(102.7)
35.2
(95.4)
29.9
(85.8)
21.7
(71.1)
17.1
(62.8)
41.7
(107.1)
Mean daily maximum °C (°F) 7.1
(44.8)
8.6
(47.5)
12.6
(54.7)
15.9
(60.6)
19.4
(66.9)
23.0
(73.4)
25.8
(78.4)
25.8
(78.4)
21.8
(71.2)
16.6
(61.9)
10.9
(51.6)
7.6
(45.7)
16.3
(61.3)
Daily mean °C (°F) 4.3
(39.7)
4.8
(40.6)
7.8
(46.0)
10.4
(50.7)
13.9
(57.0)
17.3
(63.1)
19.6
(67.3)
19.6
(67.3)
16.0
(60.8)
12.1
(53.8)
7.5
(45.5)
4.7
(40.5)
11.5
(52.7)
Mean daily minimum °C (°F) 1.4
(34.5)
1.0
(33.8)
3.0
(37.4)
4.8
(40.6)
8.4
(47.1)
11.6
(52.9)
13.4
(56.1)
13.3
(55.9)
10.2
(50.4)
7.6
(45.7)
4.1
(39.4)
1.8
(35.2)
6.7
(44.1)
Record low °C (°F) −18.8
(−1.8)
−17.2
(1.0)
−11.8
(10.8)
−6.3
(20.7)
−2.3
(27.9)
1.2
(34.2)
4.2
(39.6)
3.6
(38.5)
0.7
(33.3)
−4.6
(23.7)
−13.4
(7.9)
−16.3
(2.7)
−18.8
(−1.8)
Average precipitation mm (inches) 51.5
(2.03)
41.3
(1.63)
44.2
(1.74)
46.9
(1.85)
56.1
(2.21)
48.2
(1.90)
51.9
(2.04)
42.9
(1.69)
42.7
(1.68)
61.0
(2.40)
55.1
(2.17)
61.5
(2.42)
603.3
(23.75)
Average precipitation days (≥ 1.0 mm) 10.5 9.3 8.9 9.0 9.1 8.1 7.2 7.0 7.2 10.2 10.4 11.3 108.2
Mean monthly sunshine hours 64.8 91.9 144.2 188.7 215.6 226.4 237.7 233.0 186.6 121.1 72.7 63.0 1,845.7
Source: Meteociel[8]

See also

References

  1. ^ "Répertoire national des élus: les maires". data.gouv.fr, Plateforme ouverte des données publiques françaises (in French). 2 December 2020.
  2. ^ "Populations de référence 2022" (in French). The National Institute of Statistics and Economic Studies. 19 December 2024.
  3. ^ a b c  One or more of the preceding sentences incorporates text from a publication now in the public domainChisholm, Hugh, ed. (1911). "Châteaudun". Encyclopædia Britannica. Vol. 5 (11th ed.). Cambridge University Press. pp. 962–963.
  4. ^ Des villages de Cassini aux communes d'aujourd'hui: Commune data sheet Châteaudun, EHESS (in French).
  5. ^ Population en historique depuis 1968, INSEE
  6. ^ Museum website
  7. ^ "Villes en coopération". chambery.fr (in French). Châteaudun. Retrieved 20 November 2019.
  8. ^ "Normales et records pour Châteaudun (28)". Meteociel. Retrieved 20 November 2024.