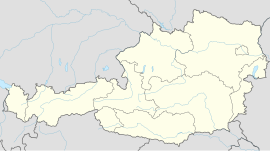
Municipality in Burgenland, Austria
Bernstein (Hungarian : Borostyánkő ) is a municipality in Burgenland in the district Oberwart in Austria .
Geography
Parts of the municipality are Dreihütten, Redlschlag, Rettenbach, and Stuben.
Population
Historical population Year 1869 2,896 — 1880 2,954 +2.0% 1890 2,921 −1.1% 1900 3,015 +3.2% 1910 2,909 −3.5% 1923 2,633 −9.5% 1934 2,690 +2.2% 1939 2,606 −3.1% 1951 2,465 −5.4% 1961 2,435 −1.2% 1971 2,470 +1.4% 1981 2,592 +4.9% 1991 2,493 −3.8% 2001 2,441 −2.1% 2011 2,267 −7.1%
Politics
Of the 23 positions on the municipal council, the SPÖ has 14, and the ÖVP 9.
Climate
Climate data for Bernstein im Burgenland (1981–2010)
Month
Jan
Feb
Mar
Apr
May
Jun
Jul
Aug
Sep
Oct
Nov
Dec
Year
Record high °C (°F)
16.0
19.2
22.5
25.3
29.7
34.0
34.6
35.2
30.0
23.9
20.9
17.0
35.2
Mean daily maximum °C (°F)
2.0
4.0
8.2
13.6
18.6
21.4
23.8
23.3
18.5
13.1
6.6
2.5
13.0
Daily mean °C (°F)
−2.0
−0.8
3.2
8.1
13.3
16.0
18.3
17.9
13.5
8.8
3.2
−0.9
8.2
Mean daily minimum °C (°F)
−3.8
−2.7
0.7
5.0
9.7
12.6
14.8
14.7
10.8
6.3
1.1
−2.8
5.5
Record low °C (°F)
−19.0
−19.9
−15.0
−6.5
0.0
2.7
6.0
4.7
2.5
−6.0
−11.8
−16.7
−19.9
Average snowfall cm (inches)
16
20
20
6
0
0
0
0
0
1
13
21
96
Average relative humidity (%) (at 14:00)
71.1
61.8
57.9
52.7
55.7
58.0
55.1
56.5
61.0
66.6
73.7
74.8
62.1
Source: Central Institute for Meteorology and Geodynamics [ 3] [ 4] [ 5] [ 6] [ 7]
Climate data for Bernstein im Burgenland (1971–2000)
Month
Jan
Feb
Mar
Apr
May
Jun
Jul
Aug
Sep
Oct
Nov
Dec
Year
Record high °C (°F)
16.0
19.2
23.0
25.3
28.3
34.0
33.5
34.0
30.0
23.3
20.4
16.6
34.0
Mean daily maximum °C (°F)
1.6
3.7
7.9
12.7
17.9
20.7
23.0
22.7
18.4
12.5
6.0
2.8
12.5
Daily mean °C (°F)
−1.7
−0.1
3.5
7.9
13.0
15.9
18.2
17.9
13.8
8.5
2.8
−0.3
8.3
Mean daily minimum °C (°F)
−4.2
−2.8
0.4
4.1
9.0
11.9
14.0
14.0
10.5
5.7
0.4
−2.7
5.0
Record low °C (°F)
−19.0
−19.9
−16.5
−5.4
−2.0
2.0
6.0
6.0
1.5
−4.7
−11.8
−16.7
−19.9
Average precipitation mm (inches)
26.0
26.0
39.5
48.0
82.0
114.8
96.2
82.5
71.4
47.0
51.7
33.2
718.3
Average snowfall cm (inches)
16.3
19.0
24.9
8.3
0.0
0.0
0.0
0.0
0.0
0.2
13.4
21.3
103.4
Average precipitation days (≥ 1.0 mm)
4.9
5.0
7.3
7.6
9.6
10.1
9.4
8.7
6.7
6.1
7.9
5.8
89.1
Average relative humidity (%) (at 14:00)
73.8
65.0
60.1
55.4
57.3
58.9
57.0
57.7
62.3
66.4
73.2
74.1
63.4
Source: Central Institute for Meteorology and Geodynamics [ 8]
Sightseeing
Notable residents
References
External links
Municipalities in the district of
Oberwart
International National Geographic


