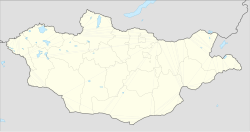
District in Bayankhongor Province, Mongolia
District in Bayankhongor, Mongolia
Bayanbulag (Mongolian: Баянбулаг, rich spring) is a sum (district) of Bayankhongor Province in southern Mongolia. In 2006, its population was 2,143.[1]
Climate
Bayanbulag has a cold semi-arid climate (Köppen climate classification BSk) with mild summers and severely cold winters. The climate is very dry; most precipitation falls in the summer as rain, with some snow in the adjacent months of May and September. Winters are very dry.
| Climate data for Bayanbulag, elevation 2,255 m (7,398 ft), (1991–2020 normals, extremes 1975–2020)
|
| Month
|
Jan
|
Feb
|
Mar
|
Apr
|
May
|
Jun
|
Jul
|
Aug
|
Sep
|
Oct
|
Nov
|
Dec
|
Year
|
| Record high °C (°F)
|
4.0
(39.2)
|
6.4
(43.5)
|
13.7
(56.7)
|
23.2
(73.8)
|
27.9
(82.2)
|
29.3
(84.7)
|
32.7
(90.9)
|
28.6
(83.5)
|
23.8
(74.8)
|
19.6
(67.3)
|
10.6
(51.1)
|
7.8
(46.0)
|
32.7
(90.9)
|
| Mean daily maximum °C (°F)
|
−13.3
(8.1)
|
−9.3
(15.3)
|
−1.2
(29.8)
|
7.2
(45.0)
|
13.3
(55.9)
|
19.0
(66.2)
|
21.3
(70.3)
|
19.5
(67.1)
|
13.2
(55.8)
|
5.1
(41.2)
|
−4.1
(24.6)
|
−11.2
(11.8)
|
5.0
(40.9)
|
| Daily mean °C (°F)
|
−22.6
(−8.7)
|
−19.0
(−2.2)
|
−10.3
(13.5)
|
−0.1
(31.8)
|
6.1
(43.0)
|
12.4
(54.3)
|
14.6
(58.3)
|
12.2
(54.0)
|
5.3
(41.5)
|
−3.5
(25.7)
|
−13.0
(8.6)
|
−20.3
(−4.5)
|
−3.2
(26.3)
|
| Mean daily minimum °C (°F)
|
−30.2
(−22.4)
|
−27.5
(−17.5)
|
−18.6
(−1.5)
|
−7.9
(17.8)
|
−2.1
(28.2)
|
4.3
(39.7)
|
7.0
(44.6)
|
4.3
(39.7)
|
−3.0
(26.6)
|
−10.8
(12.6)
|
−19.9
(−3.8)
|
−27.3
(−17.1)
|
−11.0
(12.2)
|
| Record low °C (°F)
|
−48.1
(−54.6)
|
−45.0
(−49.0)
|
−40.2
(−40.4)
|
−35.4
(−31.7)
|
−23.8
(−10.8)
|
−11.4
(11.5)
|
−7.8
(18.0)
|
−9.0
(15.8)
|
−17.3
(0.9)
|
−29.9
(−21.8)
|
−40.4
(−40.7)
|
−45.5
(−49.9)
|
−48.1
(−54.6)
|
| Average precipitation mm (inches)
|
1.1
(0.04)
|
1.4
(0.06)
|
4.7
(0.19)
|
4.2
(0.17)
|
8.8
(0.35)
|
28.0
(1.10)
|
46.5
(1.83)
|
32.5
(1.28)
|
11.1
(0.44)
|
4.1
(0.16)
|
1.9
(0.07)
|
1.3
(0.05)
|
145.8
(5.74)
|
| Average precipitation days (≥ 1 mm)
|
0.4
|
0.3
|
0.9
|
0.9
|
1.7
|
3.8
|
6.1
|
4.9
|
2.1
|
1.2
|
0.7
|
0.4
|
23.0
|
| Average snowy days
|
2.4
|
2.3
|
4.0
|
4.6
|
2.0
|
0.0
|
0.0
|
0.0
|
0.0
|
3.5
|
3.2
|
2.8
|
24.9
|
| Average relative humidity (%)
|
63
|
57
|
54
|
49
|
41
|
42
|
49
|
56
|
49
|
58
|
62
|
65
|
54
|
| Source 1: NOAA (humidity 1981–2010)[2][3]
|
| Source 2: Office of Meteorology and Environmental Analysis[4][5][6]Starlings Roost Weather[7]
|
References
