|
Hungarian stock market index
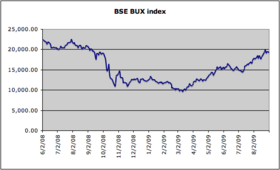
BUX is a blue chip stock market index consisting up to 25 (currently 16) major Hungarian companies trading on the Budapest Stock Exchange. Prices are taken from the electronic Xetra trading system. According to the operator Budapest Stock Exchange, the BUX measures the performance of the Equities Prime Market's 12 to 25 largest Hungarian companies in terms of order book volume and market capitalization.[1] It is the equivalent of the Dow Jones Industrial Average and DAX, the index shows the average price changing of the shares with the biggest market value and turnover in the equity section. Hereby this is the most important index number of the exchange trends.
BSE was one of the first in the world who started to use free-float capitalisation weightings instead of the traditional market capitalisation weightings in October 1999. The base date for the BUX is 2 January 1991 and it was started from a base value of 1,000. It is calculated in real-time based on the actual market prices of a basket of shares. The BUX index is also a tradeable index. Its futures and option products are available in BSE's derivatives section.
Ticker codes: Reuters: BUX,[2] Bloomberg: BUX.[3]
Annual returns
The following table shows the annual development of the BUX since 1991.[4]
| Year
|
Closing level
|
Change in index
in points
|
Change in index
in %
|
| 1991 |
838.32 |
|
|
| 1992 |
891.97 |
53.65 |
6.40
|
| 1993 |
1,264.02 |
372.05 |
41.71
|
| 1994 |
1,470.13 |
206.11 |
16.31
|
| 1995 |
1,528.92 |
58.79 |
4.00
|
| 1996 |
4,134.31 |
2,605.39 |
170.41
|
| 1997 |
7,999.10 |
3,864.79 |
93.48
|
| 1998 |
6,307.67 |
−1,691.43 |
−21.15
|
| 1999 |
8,819.45 |
2,511.78 |
39.82
|
| 2000 |
7,849.75 |
−969.70 |
−11.00
|
| 2001 |
7,131.13 |
−718.62 |
−9.15
|
| 2002 |
7,798.29 |
667.16 |
9.36
|
| 2003 |
9,379.99 |
1,581.70 |
20.28
|
| 2004 |
14,742.60 |
5,362.61 |
57.17
|
| 2005 |
20,784.70 |
6,042.10 |
40.98
|
| 2006 |
24,874.40 |
4,089.70 |
19.68
|
| 2007 |
26,235.60 |
1,361.20 |
5.47
|
| 2008 |
12,241.70 |
−13,993.90 |
−53.34
|
| 2009 |
21,227.00 |
8,985.30 |
73.40
|
| 2010 |
21,327.07 |
100.07 |
0.47
|
| 2011 |
16,974.24 |
−4,352.83 |
−20.41
|
| 2012 |
18,173.20 |
1,198.96 |
7.06
|
| 2013
|
18,564.08
|
390.88
|
2.15
|
| 2014
|
16,634.00
|
−1,930.08
|
−10.40
|
| 2015
|
23,920.65
|
7,286.65
|
43.81
|
| 2016
|
32,003.05
|
8,082.40
|
33.79
|
| 2017
|
39,377.31
|
7,374.26
|
23.04
|
| 2018
|
39,138.95
|
−238.36
|
−0.61
|
| 2019
|
46,082.82
|
6,943.87
|
17.74
|
| 2020
|
42,100.00
|
−3,982.82
|
−8.64
|
| 2021
|
50,721.71
|
8,621.00
|
20.48
|
| 2022
|
43,793.76
|
−6,927.2
|
−13.66
|
| 2023
|
60,620.00
|
16,826.2
|
38.42
|
Components
The current components and weightings of the index: BUX Composition
Since the March 2022 adjustment, the BUX consists of the following major Hungarian companies:
| Company
|
Exchange
|
Ticker
|
ICB Sector
|
Date of listing
|
Index weighting (%)
|
| 4iG
|
BSE
|
4IG
|
Telecommunications
|
2004-09-22
|
0.93
|
| ALTEO
|
BSE
|
ALTEO
|
Electric Utilities
|
2010-10-12
|
0.32
|
| ANY Security Printing
|
BSE
|
ANY
|
Diversified Industrials
|
2005-12-08
|
0.72
|
| Appeninn Asset Management
|
BSE
|
APPENINN
|
Real Estate
|
2010-07-02
|
0.27
|
| AutoWallis
|
BSE
|
AUTOWALLIS
|
Automobiles & Parts
|
2013-06-25
|
0.42
|
| Budapest Real Estate
|
BSE
|
BIF
|
Real Estate
|
1998.02.16
|
0.42
|
| CIG Pannonia
|
BSE
|
CIGPANNONIA
|
Insurance
|
2010-11-08
|
0.29
|
| Delta Technologies
|
BSE
|
DELTA
|
Informatics
|
1999.02.01
|
0.13
|
| Graphisoft
|
BSE
|
GSPARK
|
Real Estate
|
2006-08-28
|
0.53
|
| Masterplast
|
BSE
|
MASTERPLAST
|
Construction
|
2011-11-29
|
0.55
|
| MOL Group
|
BSE
|
MOL
|
Oil & Gas
|
1995-11-28
|
24.43
|
| Magyar Telekom
|
BSE
|
MTELEKOM
|
Telecommunications
|
1997-11-14
|
6.53
|
| Opus Global
|
BSE
|
OPUS
|
Industrial conglomerate
|
1998-04-22
|
2.24
|
| OTP Bank
|
BSE
|
OTP
|
Banks
|
1995-08-10
|
39.62
|
| PannErgy
|
BSE
|
PANNERGY
|
Industrial Services
|
1994-06-13
|
0.26
|
| Gedeon Richter
|
BSE
|
RICHTER
|
Pharmaceuticals
|
1994-11-09
|
21.96
|
| Waberer's International
|
BSE
|
WABERERS
|
Industrial Transportation
|
2017-06-20
|
0.37
|
See also
References
External links
|
