|
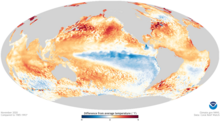
2020–2023 La Niña eventThe 2020–2023 La Niña event was a rare three-year, triple-dip La Niña.[1] The impact of the event led to numerous natural disasters that were either sparked or fueled by La Niña. La Niña refers to the reduction in the temperature of the ocean surface across the central and eastern equatorial Pacific, accompanied by notable changes in the tropical atmospheric circulation. This includes alterations in wind patterns, pressure, and rainfall. The cold phase of the El Niño Southern Oscillation (ENSO), known as La Niña, typically produces contrasting effects on weather and climate compared to El Niño, which is the warm phase of the same phenomenon.[2] Meteorological background and progression The 2020–2023 La Niña event was unusual in that it featured three consecutive years of La Niña conditions (also called a "triple-dip" La Niña) in contrast to the typical 9–12 month cycles of the El Niño–Southern Oscillation (ENSO),[3] though the magnitude of the anomalous sea surface temperatures (SST) was relatively small compared to prior La Niña events.[4][5] Of the 13 La Niña events between 1951–2023, three lasted for three years;[6] the 2020–2023 event was the first triple-dip event of the 21st century.[7] The atypical prolonging of conditions produced by triple-dip La Niña events present globally increased risks from extreme weather. Unlike previous triple-dip La Niña events, the 2020–2023 event was not preceded by a strong El Niño event.[6] Rather, the event followed a period of neutral ENSO or borderline El Niño conditions in the winter of 2019, with the subsequent triple-dip behavior not projected by most computer forecasting models.[4][8] This behavior challenged the leading theory that strong La Niña events were enabled by the mass transport of ocean heat content poleward by strong El Niño events.[3][9] Instead, the unusual length of the 2020–2023 event may have been a consequence of interactions between the northern and southern Pacific Ocean, smoke from the abnormally active 2019–20 Australian bushfire season, or a change in the behavior of ENSO stemming from climate change.[3] Unusually southeasterly winds throughout the tropical central and eastern Pacific persisted throughout the event.[10] The cooler-than-average SSTs associated with La Niña first materialized in the spring of 2020, with the magnitude of SST anomalies peaking in late 2020 and early 2021.[6] The NOAA's Oceanic Niño Index (ONI) reached a minimum of −1.3 °C (−2.3 °F) during the October–December 2020 trimonthly period.[11] This first phase of La Niña may have been linked to changes in the Indian Ocean Dipole in 2019.[12] The SST anomalies subsequently tapered, with a brief hiatus in strongly negative values in mid-2021, but reintensified in late 2021 and early 2022. Negative SST anomalies were maintained throughout 2022 but began to taper in the winter of 2022–2023 before giving way to neutral SST conditions in February 2023.[6] This second phase of the triple-dip La Niña may have been connected to an Atlantic Niño event.[12] EffectsThere was record-setting tropical cyclone activity in the North Atlantic Ocean during the 2020 and 2021 hurricane seasons, with the 2020 season being the most active on record, and the 2021 season being the third-most active.[13][14] Numerous different catastrophic tropical cyclones, most notably hurricanes Laura, Eta, Iota, Ida, Fiona and Ian, made landfall during the event, leading to hundreds of billions of dollars in property damage to go alongside hundreds of deaths. Australia and New ZealandIn Australia, the whole country (especially New South Wales) experienced one of its wettest Marches on record following torrential rainfall in March 2021 during the 2021 Eastern Australia floods, which resulted in over A$1 billion (about $670 million USD) in damage from destroyed homes and roads.[15] In New Zealand, North Island experienced one of its wettest summers on record following the catastrophic events of the 2023 North Island floods, which resulted in roughly NZ$1.9 billion in damage.[16] South AmericaIn the Southern Cone of South America, heatwaves were registered during many consecutive summer seasons, causing fires and droughts in Argentina and in Chile.[17][18] Additionally, it led to the March 2022 Suriname floods, which occurred in eastern Suriname during March 2022.[19] References
|
